ФУЗАРИОЗА КОЛОСА, РОСТ, УРОЖАЙНОСТЬ И КАЧЕСТВЕННЫЕ ПРИЗНАКИ ЯРОВОЙ ПШЕНИЦЫ В ЗАВИСИМОСТИ ОТ СОРТА И ТЕХНОЛОГИИ ВОЗДЕЛЫВАНИЯ
ФУЗАРИОЗА КОЛОСА, РОСТ, УРОЖАЙНОСТЬ И КАЧЕСТВЕННЫЕ ПРИЗНАКИ ЯРОВОЙ ПШЕНИЦЫ В ЗАВИСИМОСТИ ОТ СОРТА И ТЕХНОЛОГИИ ВОЗДЕЛЫВАНИЯ
Аннотация
Пшеница выращивается практически во всех географических точках мира. Ее экономическое и питательное значение для миллионов мелких фермеров, неимущих и недоедающих людей неоспоримо. Следовательно, пшеница необходима для обеспечения глобальной продовольственной и пищевой безопасности. Поэтому в Российском федеральном исследовательском центре, Немчиновка, Московская область, Россия, в 2022 и 2023 годах был проведен двухлетний полевой опыт по оценке лучших технологий возделывания и селекции сортов для получения высоких урожайных и качественных признаков и устойчивости сортов к фузариозу колоса. В исследовании использовали три технологии возделывания, включая базовую, интенсивную и высокоинтенсивную, с различным уровнем удобрений, гербицидов, инсектицидов, фунгицидов регулятор роста; и три сорта яровой пшеницы (Агрос, Беляна и Радмира), размещенные в схеме с тремя повторениями. Результаты показали, что все сорта хорошо реагировали на технологию возделывания, при этом Агрос и Радмира достигли положительного взаимодействия и показали высокие показатели урожайности и качества при использовании интенсивной и высокоинтенсивной технологии. Кроме того, эти генотипы продемонстрировали положительную коррекцию под интенсивной технологией, что свидетельствует об их устойчивости к развитию фузариоза колоса. Несмотря на это, сорт Беляна продемонстрировал большую устойчивость к фузариозу колоса, чем два других генотипа, что подтверждает необходимость интеграции устойчивых генотипов с передовыми технологиями для устойчивого земледелия пшеницы. Для решения глобальных проблем продовольственной безопасности данное исследование может проложить путь к внедрению адаптированных технологий земледелия, которые удовлетворяют конкретные региональные потребности и одновременно снижают развития заболеваний.
1. Introduction
Wheat (Triticum aestivum L.) is the second-largest crop cultivated after maize; it holds significant cultural importance in Europe, Asia, and some regions of Africa. Its grains are used for food and other confectionary products that are globally accepted and contribute to preserving diverse global cuisines by enhancing the taste, texture, and nutrition of foods that are part of our cultural heritage , , . Wheat is rich in several essential elements, including protein, dietary fiber, manganese, phosphorus, and niacin, accounts for 50% of the total global calorie intake and 40% of the protein consumption; its grains also contain 12% water, 70% carbohydrates, 12% protein, 2% fat, 1.8% minerals, and 2.2% crude fibers, making it essential for ensuring global food security and nutrition , , , . Wheat is a crucial component in agro-food industries across the globe, its straw can be used in producing paper, insulation, and animal bedding , , , . Therefore, agricultural experts and professionals focusing on wheat cultivation to enhance global food and nutrition security should focus on wheat cultivation techniques and varieties that are high-yielding, with better quality traits, and resistant to disease , , . According to Kingwell et al. , Aula et al. , Sułek et al. , Sułek et al. , spring wheat production techniques are facing weak linkages among producers, researchers, and extension services, resulting in less adoption of technologies that could increase its productivity, hence reduce disease infection. According to researchers, the use of appropriate fertilizers and the best varietal selection to reduce the severity of disease infection at the vegetative and maturity stages of wheat development is a crucial area of focus that could sustain food production to feed the world population by 2050 , , , . This study evaluated the best varietal selection for high-yield and quality traits, growth parameters, and disease-resistance genotypes under various cultivation technologies that can be universally accepted. The findings from this study will facilitate the adoption of modified cultivation technology that targets certain regional requirements while tackling disease severity to ensure global food security issues.
2. Research methods and principles
2.1. Experimental site and materials
This study was conducted at the Russian Federal Research Center, Nemchinovka, Moscow region in the Russian Federation. The soil was Soddy-Podzolic medium loamy with fine, mixed, active, and ~2.2% soil organic matter. The experiment was conducted in the 2022 and 2023 growing seasons. The experimental plot area was 20 m × 4 m (80 m2) with an intra-plot spacing of 1.0 m and inter-block spacing of 1.0 m, with each block comprising nine plots, totaling 27 plots. The experiment was a 3 × 3 factorial laid out in a split-plot design with three replications, three cultivation technologies (Basic, Intensive, and High-Intensive, at varying levels of fertilizer, herbicide, insecticide, fungicide), and three spring wheat varieties comprising Agros and Belyana (advanced breeding lines) from the Nemchinovka, and Radmira improved genotype (Table 1).
Table 1 - Inputs used in the examined cultivation technologies and wheat varieties
Cultivation Technologies | Fertilizers (Kgha-1) | Chemicals used in Seed Treatment | Crop protection chemicals used in the study | Active ingredients of crop protection chemicals used |
Soil application and Top-dressing | Pre-sowing seed treatment | |||
Basic | N30 P40 K90 | Oplot Trio (500 ml t-1) | Herbicides: Ballerina 0.5 lha-1 + Fides 0.4 Lha-1
Insecticide: Borey Neo 0.2 l/ha-1
Fungicide: Kolosal Pro 0.4 l ha-1 | 2,4-D acid (2-ethylhexyl ester) 410 g l-1 + florasulam 7.4 g l-1.
Fenoxaprop-P-ethyl +antidote Mefenpyr-diethyl 100 +27 gl-1.
Alpha- cypermethrin 125 g l-1, + Imidacloprid 100 gl-1 + clothianidin 50 g l-1
Propiconazole 300 gl-1 + Tebuconazole 200g l-1 |
Intensive | N30 P60 K120
Top-dressing at Tillering stage N30 | Oplot Trio (500 mlt-1) | Herbicide: Lintur 0.16 kg ha-1 + Puma Super 100 0.6 l ha-1
Insecticide: Decis Profi 0.03 kg ha-1
Fungicide: Kolosal pro 0.5 l ha-1
Plant growth regulator: HEFC 0.8 l ha-1 | Dicamba acid (in the form of Sodium salt) 659 g kg-1 + Triasulfuron 41g kg-1.
Fenoxaprop-P-ethyl + antidote Mefenpyr- diethyl (100 + 27g l-1)
Deltamethrin 250 gl-1
Propiconazole 300 gl-1 +
Tebuconazole 200 g l-1
Ethephon 480 gl-1 |
High Intensive | N30 P90 K150
Top-dressing at Tillering stage N30
Top-dressing at Joining growth stage N30 | Oplot Trio (500 mlt-1) | Herbicide: Lintur 0.16 kg ha-1 + Puma Super 7.5 0.6 l ha-1
Insecticide: Decis Profi 0.03 kg ha-1
Fungicide: kolosal pro 0.6 l ha-1
Plant growth regulator: HEFC 0.8 l ha-1 | Dicamba acid (in the form of Sodium salt) 659 gkg-1 + Triasulfuron 41gkg-1.
Fenoxaprop-P-ethyl + antidote Mefenpyr- diethyl (69 +75 gl-1)
Deltamethrin 250 gl-1
Propiconazole 300 gl-1 + Tebuconazole 200 gl-1
Ethephon 480 gl-1 |
2.2. Agronomic practices
All agronomic practices were observed following the agricultural management procedures for this region . Seeds were treated with Oplot Trio (500 mL ha-1) using the procedure outlined in the operating handbook . A seeder called Amazon D9-40 was used, with a seeding rate of 60 kg ha-1, resulting in a plant density of 4-5 million germinating seeds ha-1 , , .
2.3. Meteorological data
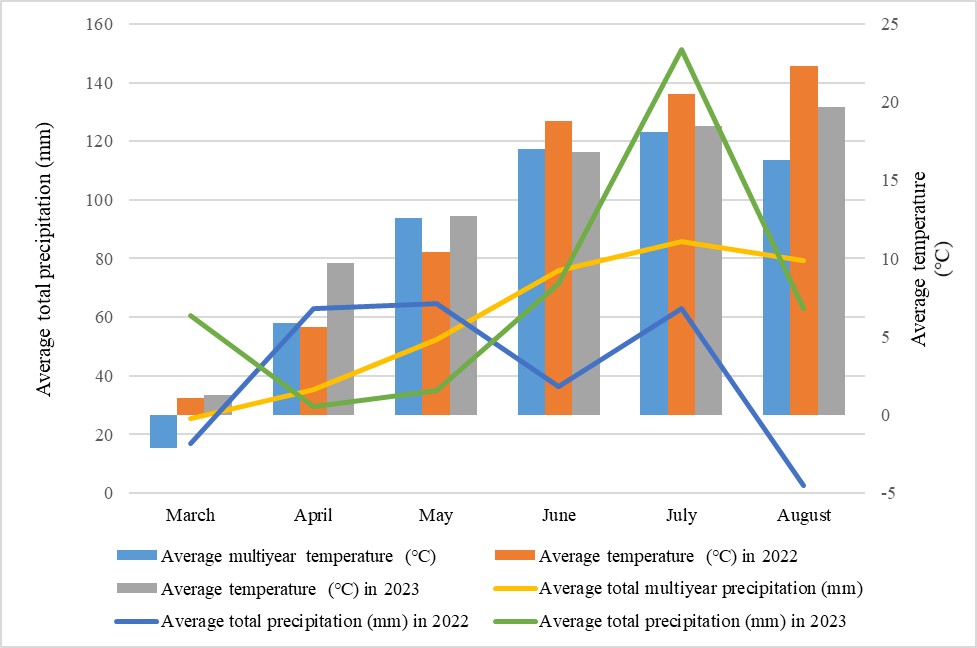
Figure 1 - Meteorological conditions 2022 and 2023
Note: Nemchinovka weather station
In 2022 and 2023, 50 wheat heads from each cultivar were collected during the late milk to early dough development stages (GS 77-83). These samples were taken from randomly selected plants along a diagonal transect across the three replicate plots. FHB incidence and disease severity were visually assessed on 100 heads per cultivar. FHB incidence was measured as the percentage of heads showing symptoms, while disease severity (DS) was quantified as the percentage of spikelets per head exhibiting bleaching. The evaluation of DS was based on the proportion of infected spikelets per head using the FHB disease rating scale (Table 2). The FHB incidence and severity was calculated using the following formulas :
And
Where, (n)= Number of spikes in each category, (v) = Numerical values of symptoms category.
(N)= Total number of spikes, (5) = Maximum scale.
Table 2 - Disease rating scales for Fusarium head blight
Scale | Description of the symptoms |
0 | Spikelets free from bleached |
1 | Small Spikelet discoloration covering ˂5% spike |
2 | Small irregular bleached florets with concentric rings covering 5.1-10% spikelets |
3 | Enlargement of infected spikelets that have developed pink, orange, or salmon-colored fungal spores covering 10.1-25% spikelets |
4 | Premature ripening: Spikelets ripen early, resulting in shriveled, lightweight, and discolored grains as a typical blight symptom covering 25.1- 50% of spike |
5 | Enlargement of irregular dark Brown Lesions covering a typical blight symptom covering > 50% of spikelets |
Note: based on [22]
2.5. Statistical Data Analysis
A total of 11 parameters were determined using analysis of variance (ANOVA) and were subjected to the GENSTAT statistical program (GENSTAT, 15th release, Rothampstead, UK). The Student Newman-Keuls multiple range test (SNK) was employed to compare treatment means, with a significance level set at α = 0.05. To ensure the validity of the data, residuals were initially assessed for normality and homogeneity using Shapiro-Wilk and Bartlett’s tests, confirming adherence to the assumptions of normal distribution following the methodologies outlined by .
3. Main results
3.1. Impact of Variety and Cultivation Technology on Spring Wheat Growth Traits
Varietal Effect on Growth Traits: The effects of variety and cultivation technology on the growth traits of spring wheat are presented in (Table 3). Generally, variety and cultivation technology significantly (p < 0.05) influenced the studied varieties' growth, yield, and quality. Agros, Belyana, and Radmira varieties exhibited varying performances across all the measured traits. The Agros variety significantly shows the tallest average plant height (109.14 cm), insinuating that Agros could have superior genetic traits contributing to taller plant heights. The Radmira variety had the longest spike length (10.20 cm). All three varieties exhibited a similar number of spikelets per spike, with Radmira showing a trivial advantage at 16.30 spikelets.
Cultivation Technology Effect: The cultivation technologies also influence growth traits. Intensive Cultivation Technology (ICT) had the tallest plants with an average of 103.98 cm but exhibited a moderate number of spikelets per spike (16.17) and spike length (9.86 cm). In comparison, Basic Cultivation Technology (BCT) had the shortest plants (95.12 cm) with the least number of spikelets per spike (8.86) and a spike length of 15.19 cm (Table 3). The longest spike length was attained under High-Intensive Technology (HICT) (9.93 cm) and had the highest number of spikelets per spike (16.82), indicating that these traits can perform better using this technology. It may be worth noting that HICT did not promote maximum plant height as ICT, but it enhanced reproductive structures (length of spike and number of spikelets per spike). The BCT demonstrated the least traits across all varieties.
Table 3 - Impacts of Variety and Cultivation Technologies on growth parameters of three spring wheats
Traits | Plant height (cm) | Length of spike (cm) | Number of Spikelet spike-1 |
Variety | |||
Agros | 109.14 | 9.14 | 15.91 |
Belyana | 92.39 | 9.31 | 15.98 |
Radmira | 98.68 | 10.20 | 16.30 |
Technology | |||
Basic | 95.12 | 8.86 | 15.19 |
Intensive | 103.98 | 9.86 | 16.17 |
High intensive | 101.11 | 9.93 | 16.82 |
Year | |||
2022 | 84.92 | 10.42 | 16.10 |
2023 | 115.21 | 8.68 | 16.03 |
SNK (5%) | |||
V | 0.97 | 0.32 | 0.57 |
T | 2.04 | 0.52 | 0.78 |
V*T | 1.01 | 0.30 | 0.41 |
Y | 2.12 | 0.65 | 1.08 |
V*Y | 1.43 | 0.44 | 0.66 |
T*Y | 2.11 | 0.56 | 0.81 |
V*T*Y | 2.87 | 0.88 | 1.33 |
CV (%) | 1.80 | 5.50 | 4.40 |
Note: V=Variety, T=technology, Y=year; CV=coefficients of variation, SNK=Student-Newman-Keuls was used to separate the means
3.2. Varietal Effect on Yield Traits
For varietal comparison, there was significant variation among growth traits of the varieties studied. Radmira variety had the highest number of grains per spike (40.24) but lesser weight of the grains (1.61 g) and a mass of 1000 grains (38.42 g). In contrast, the Agros variety had a low number of grains per spike (35.78) yet showed a denser weight of grains per spike (1.72 g) and a denser 1000-grain weight (42.42 g); this can be due to genetic variation, environmental conditions or disease infestation and nutrient use efficiency. Belyana variety recorded the least parameters amongst all studied parameters. However, varietal differences can result in conflicting trends; for example, the Radmira exhibited a higher number of grains per spike, while the Agros variety produced denser grains and a higher mass of 1000 grains weight (Table 4).
3.3. Cultivation Effects
The evaluations of growth traits were investigated, with a particular focus on the number of grains per spike, the weight of grains per spike, and the mass of 1000 grains, as outlined in Table 2. Notably, the highest parameters were recorded under HICT, yielding an average number of grains per spike (39.03), weight of grains per spike (1.77 g), and a 1000-grain mass (42.23 g). At the same time, ICT exhibited moderate grains per spike (38.33), weight of grains per spike (1.69 g), and 1000-grain mass (39.64 g). The BCT had the least growth traits among all the CT studied (Table 4).
Table 4 - Impacts of Variety and Cultivation Technologies on Yield Traits of Spring Wheat
Traits | Number of grains spike-1 | Weight of grains spike-1 (g) | Mass of 1000 grain weight (g) |
Variety | |||
Agros | 35.78 | 1.72 | 42.42 |
Belyana | 35.19 | 1.57 | 38.70 |
Radmira | 40.24 | 1.61 | 38.42 |
Technology | |||
Basic | 33.86 | 1.44 | 37.66 |
Intensive | 38.33 | 1.69 | 39.64 |
High intensive | 39.03 | 1.77 | 42.23 |
Year | |||
2022 | 36.26 | 1.74 | 42.56 |
2023 | 37.89 | 1.51 | 37.13 |
SNK (5%) | |||
V | 1.08 | 0.26 | 1.30 |
T | 1.89 | 0.08 | 0.37 |
V*T | 1.43 | 0.10 | 0.51 |
Y | 3.04 | 0.26 | 1.28 |
V*Y | 1.91 | 0.26 | 1.30 |
T*Y | 2.28 | 0.14 | 0.68 |
V*T*Y | 4.12 | 0.32 | 1.53 |
CV (%) | 6.80 | 6.6 | 2.30 |
Note: V=Variety, T=technology, Y=year; CV=coefficients of variation, SNK=Student-Newman-Keuls was used to separate the means
3.4. Varietal Effects on Yield and Quality Traits
The effects of variety and technological approaches on yield and quality traits were assessed (Table 5). The analysis of variance revealed insignificant differences among the three varieties. Belyana exhibited an average grain yield (4.3 t ha-1), Radmira (4.5 t ha-1), and Agros had the highest yield (4.6 t ha-1), respectively. The Radmira variety exhibited the highest gluten content (27.22%) and protein content (14.25%), and the Agros variety had the lowest gluten content (20.27%) yet maintained an acceptable protein content (12.88%). Belyana variety recorded (23.43%) gluten and (13.66%) protein content, which shows statistical similarities to Agros.
3.5. Cultivation Technology Effects
The HICT had the maximum yield of 4.89 t ha-1, followed by ICT (4.66 t ha-1), while BCT had the lowest yield of 3.85 t ha-1. The highest gluten content (27.27%) and protein content (14.60%) were attained under HICT plots, and ICT recorded moderate percentages of gluten (25.10%) and protein (13.99%), respectively. In contrast, the BCT yielded the lowest gluten (18.56%) and protein (12.20%). The results reveal that the higher the cultivation technology employed, the higher the gluten and protein content and yield in wheat grains (Table 5).
Table 5 - Impacts of Variety and Cultivation Technologies on Yield and Quality Traits of Three Spring Wheat 2022-2023
Traits | Gluten (%) | Protein (%) | Yield (t ha-1) |
Variety | |||
Agros | 20.27 | 12.88 | 4.6 |
Belyana | 23.43 | 13.66 | 4.3 |
Radmira | 27.22 | 14.25 | 4.5 |
Technology | |||
Basic | 18.56 | 12.20 | 3.85 |
Intensive | 25.10 | 13.99 | 4.66 |
High Intensive | 27.27 | 14.60 | 4.89 |
Year | |||
2022 | 23.68 | 13.07 | 4.50 |
2023 | 23.60 | 14.12 | 4.43 |
SNK (5%) | |||
V | 0.13 | 0.22 | 0.10 |
T | 0.17 | 0.32 | 0.13 |
V*T | 0.09 | 0.07 | 0.09 |
Y | 0.21 | 0.35 | 0.17 |
V*Y | 0.16 | 0.22 | 0.13 |
T*Y | 0.18 | 0.31 | 0.15 |
V*T*Y | 0.28 | 0.38 | 0.24 |
CV (%) | 0.70 | 0.90 | 3.40 |
Note: V=Variety, T=technology, Y=year; CV=coefficients of variation, SNK=Student-Newman-Keuls was used to separate the means
3.6. The Impact of Variety on Fusarium Head Blight (FHB)
Fusarium head blight (FHB), also called wheat scab or ear blight, results in the premature senescence of the wheat head and is predominantly caused by the Ascomycete fungus Fusarium graminearum. The FHB incidence and severity are shown in Table 5. The analysis of variance shows the impact of wheat varieties and cultivation technologies on the incidence and severity rate of FHB. The statistical variance revealed a significant difference between genotypes and cultivation technology. FHB incidence in Agros was high (54.44%) yet exhibited moderate severity (2.17%). Nonetheless, Belyana demonstrated a lower incidence (48.33%) and low severity (2.05%) (Table 6). Findings demonstrated that Belyana shows superior resistance to FHB compared to Agros and Radmira.
3.7. Impact of Cultivation Technology on FHB disease of spring wheat
ICT demonstrated the lowest incidence (41.39%) and severity (1.50%), signifying its effectiveness in managing FHB severity and incidence in spring wheat; BCT attained the highest incidence (58.06%) but moderate severity (2.33%). HICT exhibited a high severity rate among all tested technologies (2.47%). The results reveal that variety and cultivation technology significantly reduce the incidence and severity of FHB in spring wheat, with Belyana combined with Intensive cultivation technology emerging as the most resistant variety and cultivation technology, demonstrating the potential to mitigate both incidence and severity levels in spring wheat (Table 6).
Table 6 - Impacts of Variety and Cultivation Technologies on Fusarium Head Blight (FHB) incidence and severity of three Spring Wheat 2022-2023
Traits | FHB Incidence (%) | FHB Severity |
Variety | ||
Agros | 54.44 | 2.17 |
Belyana | 48.33 | 2.05 |
Radmira | 50.56 | 2.08 |
Technology | ||
Basic | 58.06 | 2.33 |
Intensive | 41.39 | 1.50 |
H intensive | 53.89 | 2.47 |
Year | ||
2022 | 74.63 | 2.43 |
2023 | 27.59 | 1.77 |
SNK(5%) | ||
V | 5.57 | 0.34 |
T | 2.43 | 0.50 |
V*T | 2.52 | 0.19 |
Y | 6.45 | 0.55 |
V*Y | 5.64 | 0.36 |
T*Y | 3.55 | 0.50 |
V*T*Y | 8.03 | 0.66 |
CV (%) | 8.60 | 16.20 |
Note: V=Variety, T=technology, Y=year; CV= coefficients of variation, SNK=Student-Newman-Keuls was used to separate the means
3.8. The Interactive Effects of Variety and Cultivation Technology on Spring Wheat Growth Traits
The interactive effects of variety and cultivation technologies on the growth traits of Spring Wheat were investigated, as presented in (Table 7). Generally, variety and cultivation technology significantly (p < 0.05) influenced plant height, length of spike, and number of spikelets per spike. Agro's variety produced the highest plant height (128.1 cm) with plots amended with HICT and Radmira (120.3 cm) plant height under ICT and also exhibited the longest spike lengths (11.7 cm in 2022 and 10.0 cm in 2023). All plots amended with ICT and HICT displayed a significant number of spikelets per spike, while BCT exhibited low growth traits amongst all varieties (Table 7). The number of spikelets per spike showed notable variation by variety and year. Agros (17.1) and Belyana (16.7) had the highest spikelets in 2022 under ICT, thus showing statistically similar interactions within treatments. The findings demonstrated the significance of ideal varietal selection and modified cultivation technology in enhancing growth parameters.
Table 7 - Interactive impacts of variety and cultivation technologies (a × b) on growth traits of spring wheat
| Plant height (cm) | Length of spike (cm) | Number of spikelets spike-1 | |||
Year | Year | Year | ||||
Treatment | 2022 | 2023 | 2022 | 2023 | 2022 | 2023 |
a0×b0 | 89.6 | 124.5 | 8.7 | 8.2 | 14.4 | 15.4 |
a0×b1 | 96.3 | 124.7 | 10.7 | 8.6 | 17.1 | 16.5 |
a0×b2 | 91.7 | 128.1 | 10.6 | 8.0 | 17.7 | 14.4 |
a1×b0 | 68.7 | 106.0 | 9.7 | 7.6 | 15.1 | 15.7 |
a1×b1 | 87.8 | 102.5 | 11.1 | 8.2 | 17.4 | 16.0 |
a1×b2 | 82.1 | 107.3 | 10.3 | 9.0 | 15.7 | 16.0 |
a2×b0 | 75.7 | 106.2 | 10.5 | 8.5 | 14.5 | 16.1 |
a2×b1 | 87.1 | 120.3 | 10.5 | 10.0 | 16.7 | 17.3 |
a2×b2 | 85.3 | 117.4 | 11.7 | 10.0 | 16.3 | 17.0 |
SNK (5%) | ||||||
V | 0.97 | 0.32 | 0.57 | |||
T | 2.04 | 0.52 | 0.78 | |||
V*T | 1.01 | 0.30 | 0.41 | |||
Y | 2.12 | 0.65 | 1.08 | |||
V*Y | 1.43 | 0.44 | 0.66 | |||
T*Y | 2.11 | 0.56 | 0.81 | |||
V*T*Y | 2.87 | 0.88 | 1.33 | |||
CV (%) | 1.8 | 5.5 | 4.4 | |||
Note: V=Variety, T=technology, Y=year; a0=Agros, a1=Belyana, a2=Radmira; b0=Basic, b1=intensive, b2=High intensive, CV= coefficients of variation, SNK= Student-Newman-Keuls
The highest number of grains per spike was observed in plots amended with Agros variety × HICT (42.6 in 2022) and Radmira × ICT (43.9 in 2023); this result underscores the importance of variety and integrated cultivation, which can significantly enhance number of grains per spike (Table 8). There were significant variations in the weight of grains per spike. Agros × HICT exhibited the highest weight per spike (2.3 g). BCT recorded the lowest weight of grains per spike (1.4 g) in 2022, revealing that integrated treatments are more effective in promoting grain weight, which is crucial for overall yield. The mass of 1000 grains weight was also high with Agros variety × HICT (49.8 g in 2022 and 40.5 g in 2023), indicating that this combination is particularly effective for developing denser grains. However, Agros × ICT also performed well in both years; BCT had the lowest traits. Our research findings emphasize that optimizing the combination of high-yielding varieties and ICT and HICT can increase yield attributes in spring wheat.
Table 8 - Interactive impacts of variety and cultivation technologies (a × b) on spring wheat yield attribute traits
| Number of grains spike-1 | Weight of grains spike-1 (g) | Mass of 1000 grains weigh (g) | |||
Year | Year | Year | ||||
Treatment | 2022 | 2023 | 2022 | 2023 | 2022 | 2023 |
a0×b0 | 30.3 | 32.6 | 1.4 | 1.5 | 43.0 | 37.1 |
a0×b1 | 40.4 | 34.4 | 2.1 | 1.3 | 44.6 | 39.4 |
a0×b2 | 42.6 | 34.4 | 2.3 | 1.7 | 49.8 | 40.5 |
a1×b0 | 30.9 | 33.5 | 1.4 | 1.3 | 40.1 | 35.3 |
a1×b1 | 36.9 | 35.2 | 1.8 | 1.6 | 41.1 | 36.4 |
a1×b2 | 31.8 | 42.9 | 1.7 | 1.7 | 42.5 | 36.8 |
a2×b0 | 34.6 | 41.3 | 1.5 | 1.6 | 36.3 | 34.1 |
a2×b1 | 39.2 | 43.9 | 1.8 | 1.6 | 45.3 | 36.0 |
a2×b2 | 39.6 | 42.8 | 1.7 | 1.5 | 40.3 | 38.5 |
SNK(5%) | ||||||
V | 1.08 | 0.26 | 1.30 | |||
T | 1.89 | 0.08 | 0.37 | |||
V*T | 1.43 | 0.10 | 0.51 | |||
Y | 3.04 | 0.26 | 1.28 | |||
V*Y | 1.91 | 0.26 | 1.30 | |||
T*Y | 2.28 | 0.14 | 0.68 | |||
V*T*Y | 4.12 | 0.32 | 1.53 | |||
CV(%) | 6.80 | 6.6 | 2.3 | |||
Note: V=Variety, T=technology, Y=year; a0=Agros, a1=Belyana, a2=Radmira; b0=Basic, b1=intensive, b2=High intensive, CV=coefficients of variation, SNK= Student-Newman-Keuls
The interactive impacts of Fusarium Head Blight (FHB) incidence and severity on the growth and yield attributes of three spring wheat varieties (AGROS, BELYANA, and RADMIRA) across two growing seasons (2022 and 2023) were evaluated. The data reveal significant interactions between the varieties, cultivation technologies, and the incidence and severity of FHB (Table 9).
The incidence of FHB varied significantly among the varieties and cultivation technologies. In 2022, the Agros variety showed the highest incidence at 90.0% under the basic cultivation technology, while in 2023, it dropped to 30.0% under the same treatment. The considerable decrease in FHB incidence for the Agros variety from 2022 to 2023 indicates that environmental factors or changes in management practices may have influenced disease prevalence. Belyana also exhibited high incidences, particularly in 2022 (85.0%). However, the Belyana variety incurs a low incidence (1.00%) under intensive cultivation technology in 2023 amongst all varieties, which indicates its potential for resistance to FHB. The result reveals that despite high incidence rates, severity rates varied more significantly among technologies and years. This indicates that Belyana is tolerant to the effects of FHB, allowing better growth and yield attributes despite the incidence rates, highlighting the importance of selecting resistant varieties. The cultivation technology also significantly influenced disease resistance, particularly in the FHB severity rates. Findings show that selecting resistant varieties and optimizing cultivation technologies can significantly reduce the impact of FHB. This study underlines the necessity for integrated disease management strategies considering varietal resistance and technological interventions. Thus, to enhance spring wheat production and minimize the adverse effects of FHB, it is essential to adopt effective cultivation techniques (Intensive approach) combined with resistant variety (Belyana) and focus more on adverse environmental conditions. Further research could explore the underlying mechanisms of resistance and the long-term effects of these interactions on yield stability.
Table 9 - Interactive impacts of Fusarium Head Blight Incidence and Severity on three spring wheat varieties' growth and yield attribute traits
| Fusarium Head Blight Incidence (%) | Fusarium Head Blight Severity | |||
Year | Year | ||||
Variety | Technology | 2022 | 2023 | 2022 | 2023 |
AGROS | a0×b0 | 90.0 | 30.0 | 2.90 | 1.60 |
a0×b1 | 65.0 | 23.3 | 1.85 | 1.50 | |
a0×b2 | 81.7 | 36.7 | 2.60 | 2.57 | |
BELYANA | a1×b0 | 85.0 | 25.0 | 3.20 | 1.27 |
a1×b1 | 55.0 | 18.3 | 1.65 | 1.00 | |
a1×b2 | 75.0 | 31.7 | 2.65 | 2.53 | |
RADMIRA | a2×b0 | 90.0 | 28.3 | 2.95 | 2.07 |
a2×b1 | 65.0 | 21.7 | 1.85 | 1.17 | |
a2×b2 | 65.0 | 33.3 | 2.20 | 2.27 | |
SNK(5%) | |||||
V | 5.57 | 0.34 | |||
T | 2.43 | 0.50 | |||
V*T | 2.52 | 0.19 | |||
Y | 6.45 | 0.55 | |||
V*Y | 5.64 | 0.36 | |||
T*Y | 3.55 | 0.50 | |||
V*T*Y | 8.03 | 0.66 | |||
CV (%) | 8.60 | 16.20 | |||
Note: V=Variety, T=technology, Y=year, a0=Agros, a1=Belyana, a2=Radmira; b0=Basic, b1=intensive, b2=High intensive, CV=coefficients of variation, SNK= Student-Newman-Keuls
The interaction effects of variety and cultivation method on spring wheat grain yields, protein levels, and gluten concentrations are illustrated in Table 10. The analysis of variance for the interacting effect of variety and cultivation technologies (a×b) demonstrated statistical significance (p<0.05). There was considerable statistical heterogeneity across all amended plots. In both years, the Radmira variety exhibited the highest gluten content under ICT, achieving 32.2% in each year, and also recorded the highest protein level, with 16.3% in 2022 and 15.7% in 2023. The Agros variety had the lowest gluten and protein levels under BCT, with gluten at 15.8% in both years and protein at 10.8% in 2022 and 12.3% in 2023. The results indicate that Radmira and ICT are more effective in increasing gluten and protein levels. Nevertheless, the Belyana variety with ICT demonstrated a robust protein content of 15.4% in 2023. The Agros variety had the lowest protein content under BCT, with values of 10.8% in 2022 and 12.3% in 2023. The results indicated that Radmira and ICT had better protein and gluten percentages, which is advantageous for human consumption and cattle feed. Yield attributes exhibited considerable heterogeneity among treatments. In 2022, the Agros variety achieved the maximum grain yield of 5.4 t ha-1 under ICT, while the Radmira variety recorded the lowest grain yield of 3.0 t ha-1 under BCT. In 2023, the Radmira variety achieved the maximum grain yield under ICT at 5.3 t ha-1, followed by Belyana at 4.7 t ha-1 under ICT. The results underscore that integrating appropriate varieties (Agros and Radmira) with ICT improves gluten and protein content and attains a significant grain yield, demonstrating a beneficial interaction impact.
Table 10 - Interactive impacts of variety and cultivation technologies (a × b) on spring wheat yield traits
| Gluten (%) | Protein (%) | Yield (t ha-1) | |||
Year | Year | Year | ||||
a × b | 2022 | 2023 | 2022 | 2023 | 2022 | 2023 |
a0×b0 | 15.8 | 15.8 | 10.8 | 12.3 | 4.0 | 4.1 |
a0×b1 | 24.5 | 24.5 | 13.2 | 14.2 | 5.4 | 4.7 |
a0×b2 | 20.5 | 20.5 | 12.5 | 14.3 | 4.9 | 4.4 |
a1×b0 | 19.1 | 19.1 | 11.4 | 14.2 | 4.0 | 3.2 |
a1×b1 | 25.1 | 25.1 | 12.8 | 15.4 | 5.3 | 4.3 |
a1×b2 | 26.1 | 26.1 | 13.6 | 14.6 | 5.3 | 3.9 |
a2×b0 | 21.1 | 20.4 | 12.1 | 12.4 | 3.0 | 4.8 |
a2×b1 | 32.2 | 32.2 | 16.3 | 15.7 | 4.3 | 5.3 |
a2×b2 | 28.7 | 28.7 | 15.0 | 14.0 | 4.4 | 5.1 |
SNK (5%) | ||||||
V | 0.13 | 0.22 | 0.10 | |||
T | 0.17 | 0.32 | 0.13 | |||
V*T | 0.09 | 0.07 | 0.09 | |||
Y | 0.21 | 0.35 | 0.17 | |||
V*Y | 0.16 | 0.22 | 0.13 | |||
T*Y | 0.18 | 0.31 | 0.15 | |||
V*T*Y | 0.28 | 0.38 | 0.24 | |||
CV (%) | 0.70 | 0.90 | 3.40 | |||
Note: V=Variety, T=technology, Y=year, a0=Agros, a1=Belyana, a2=Radmira; b0=Basic, b1=intensive, b2=High intensive, CV=coefficients of variation, SNK= Student-Newman-Keuls
4. Discussion
In wheat production, growth traits are known to be influenced by the following indicators for productivity: plant height, length of spike, and number of spikelets per spike. In our study, the effect of cultivation technology and varieties significantly impacted these traits, with the Agros variety (109.14 cm) having the tallest plant height and Radmira showing the longest length of spike (10.2 cm) and 16.30 spikelets per spike; this could be related to the genetic makeup of the genome. Results indicate that Agros and Radmira under ICT could be recommended for improving more growth traits in wheat breeding. Our results agree with various researchers' studies stating that growth parameters are essential in achieving high wheat production using an integrated management approach , , , . Furthermore, our findings agree with the study carried out by Loginov et al. in the northern forest-steppe of the Tyumen region, stating that the Novosibirskaya 31 wheat variety proved to be more productive in growth than other varieties under rotation and fertilizer dose similar to the cultivation technology . Similarly, Lamlom et al. found that using organic fertilizers improved plant height across many wheat cultivars studied.
The effect of cultivation technology and variety on yield and quality parameters was significantly enhanced. Agros variety attained the highest average grain yield (4.6 t ha-1), weight of grains per spike (1.72 g), and mass of 1000 grain weight (42.24 g) under ICT and HICT, respectively. Radmira had the highest number of grains per spike but weighed less, yet attained the highest gluten (27.22%) and protein (14.25%) contents under ICT. The results suggest that these varieties (Agros and Radmira) combined with ICT and HICT are key tools for farmers, producers, and breeders to adopt in order to attain maximum yield and quality in spring wheat production; farmers must implement a comprehensive strategy that integrates high-performing varieties with efficient ICT to enhance productivity. According to studies by various researchers, the number of grains per spike, the weight of grains per spike, and the mass of 1000 grains, yield, and gluten and protein contents could be attained if the right variety and the appropriate inputs are utilized , , , . Our findings agree with the view of Vlasenko et al. , who opined that in developing cultivation technology for modern varieties, it is necessary to consider the phytosanitary situation under the influence of certain agricultural techniques, including the use of appropriate pesticides, which ultimately provide different yields and quality depending on the level of intensification of cultivation technologies and soft spring wheat varieties. According to Loginov et al. , mineral fertilizers and crop protection agents increase wheat yield, weight of grains, gluten, and protein contents by improving soil moisture retention and nutrient availability at the appropriate period for the wheat systems. Ahmadi et al. found that different wheat cultivars display substantial diversity in these characteristics when treated with different agronomic techniques. Our results agree with their findings, showing that selecting Agros and Radmira varieties with ICT not only enhances gluten and protein contents but also maximizes yield, indicating an interactive effect. Moreover, our studies observed that the Radmira variety, under intensive technology, had the highest gluten and protein contents over the two varieties used. These findings are in agreement with Mitura et al. , Rebouh et l. Wang et al. , who stated that protein content and gluten strength are all essential quality traits to consider when assessing wheat market value. Their studies stated that cultivars treated with mineral fertilizers have more outstanding protein and gluten content than the traditional growing methods. Furthermore, Mullualem et al. stressed the significance of genotype-environment interactions on quality attributes, with cultivars demonstrating greater gluten strength when grown in areas with appropriate nutrient availability.
Most studies have been limited to evaluating yield and quality of wheat traits, leaving intensive input as a factor to explore the effect of spring wheat varieties and cultivation technologies that are resistant to FHB disease in the field. Wheat diseases are crucial due to the diminished yield, quality, and marketability that affect wheat-grading factors such as test weight, damage, color, smell, and toxin content and F. graminearum is among the devastating diseases that pose significant threats to wheat production, causing substantial losses in susceptible wheat varieties worldwide . Wheat losses caused by FHB are of considerable concern, with global losses ranging from 5% to 45% , , . This means there is a constant need for new solutions to control plant-pathogenic fungi . Our study unraveled the effects of integrated cultivation technique and variety on FHB infection in field-grown spring wheat genotypes. Our study reveals the significant correlation between varietal selection and cultivation technology to increase yield and quality traits and reduce the severity of FHB infection in spring wheat. Findings indicate that, though the Agros variety was highly invaded by FHB (54.44%) incidence, it incurred less severity of (2.17%) under plots amended with ICT. Furthermore, it was observed that the Belyana variety (2.05%) was highly tolerant to FHB under intensive cultivation technology, allowing it for better growth and yield attributes despite the incidence of (48.33%), which highlights the importance of selecting resistant varieties. In addition, our study established that the incidence and severity of Fusarium head blight varied not only with variety but also with cultivation technique, with BCT having high incidence Table 4 and 7 and (high technology) yet incurring low severity across treatments, indicating the effectiveness of treatment and variety selected. Our findings are in agreement with Rebouh et al. , Wang et al. , Tudor et al. , and Alisaac and Mahlein, who opined that NPK fertilizers and crop protection products are critical in maximizing yield potential and reducing disease incidence in wheat. Additionally, according to Różewicz et al. , who studied the resistance of wheat cultivars to pathogens, such as Fusarium head blight and rust diseases, across different agronomic practices, specific cultivars displayed resilience when grown in low chemical input systems compared to high input system .
5. Conclusion
The study accentuates the need for appropriate varietal selection and cultivation technology to enhance spring wheat's growth, yield, and quality. Also, it brings out the best management strategies that can increase wheat resistance to Fusarium Head Blight (FHB). Agros and Radmira varieties, though, yielded the best in yield and quality traits over Belyana. Nonetheless, Belyana exhibited more resistance to FHB compared to the two cultivars with intensive cultivation technology. In conclusion, yield, quality, and the incidence and severity of FHB were influenced by both variety and cultivation, our results emphasize the need for integrating resistant varieties with advanced practices for sustainable wheat farming. This study could facilitate the adoption of modified cultivation technology that targets specific regional requirements while tackling disease severity to ensure global food security issues.