Genetic Variability in Salmon Groups Revealed by Multilocus Genomic DNA Analysis
Genetic Variability in Salmon Groups Revealed by Multilocus Genomic DNA Analysis
Abstract
Salmon fish are an important subject of industrial fishing and aquaculture. In recent years, much attention has been paid to breeding work with this fish. Several highly productive breeds have been developed that are adapted to conditions in recirculating aquaculture systems. The breeding of such breeds is accompanied by molecular genetic analysis of the populations. Basically, the new breeds belong to the biological species of fish – Rainbow Trout. The goal of the work was to determine the genetic structure of three groups of Trout – Onega, Caspian and Baltic salmon by identifying polymorphism in the lengths of restriction fragments of DNA. The obtained genetic profiles of each group of fish are discussed from the point of view of using these data in breeding work. Such indicators as average heterozygosity, the presence of marker DNA fragments and genetic distances were quantitatively assessed and discussed. According to the latter indicator, Onega and Baltic salmon turned out to be genetically related, as expected from known breeding history. These data are useful for genetic certification of fish breeds and populations.
1. Introduction
Intensive fishing in open waters has led to an exhaustion of fish resources on a global scale. In this regard, fish breeding in closed reservoirs and in aquaculture conditions using recirculating water supply installations is becoming increasingly important , . However, not all wild forms are suitable for such a system, so breeding new breeds and varieties of salmon fish becomes an urgent task. This makes it possible to achieve a higher output per unit area . Breeding science has achieved the greatest success when working with forms of Rainbow Trout. In cold-water fish farming in Russia, seven trout breeds are cultivated, of which four are domestic – Rostal, Rofor, Adler Amber, Adler and three imported – Steelhead salmon, Kamloops and Donaldson.
Selection in trout farming is based on the use of both cultivated previously raised breeds and commercial fish from different habitats. The latter forms include Onega, Baltic and Caspian salmon. Their use in breeding work during crossing requires data on the genetic and population characteristics of these fish. Molecular genetic methods have provided breeders with tools to control the genetic structure of fish populations . These methods even make it possible to predict the sex of individuals in the early stages of fish ontogenesis . Methods have been well-developed for using the effect of heterosis to improve the productive traits of fish when crossing genetically different forms, confirming the history of breeding and improving breeds , . The aim of the study is to reveal main population and genetic parameters in three salmon fish groups. To achieve this aim the following research tasks are formulated: selection of experimental groups of fish, extraction of genomic DNA, conducting molecular hybridization with the labeled DNA probe, analysis of distribution of colored DNA fragments on a nylon filter.
2. Research methods and principles
To isolate genomic DNA, we used venous blood from the tail vein of fish from Onega, Caspian, and Baltic salmon (n = 10, in groups of Baltic and Сaspian salmon, n = 9 with Onega salmon). DNA was extracted using conventional methods using cell lysis in buffer with sodium dodecyl sulfate; removal of the bulk of proteins was achieved by incubation with proteinase K for 3 hours at 55ºC. After shaking the mixture with phenol and centrifugation, the upper phase with DNA was collected into new tubes. DNA was precipitated with ethanol and washed with 70% ethanol to remove remaining salts. The purified DNA was dissolved in TE buffer (10 mM Tris, 1 mM EDTA, pH 8.0). The quantitative and qualitative parameters of the samples were monitored in a NanoDrop 2000™ spectrophotometer at absorption wavelengths of 260, 280 and 320 nm.
Multilocus genome analysis was performed through successive steps of DNA digestion, electrophoresis, and molecular hybridization. Genomic DNA was digested with restriction enzyme BsuRI for 3 hours at 37ºC. The resulting samples were dissolved in distilled water and added to the wells of 0.8% agarose gel. Electrophoresis was carried out for 24 hours at 60V. The DNA in the gel was denatured with alkali, neutralized, and transferred to a positively charged nylon filter. Single-stranded DNA fragments were fixed by incubation in a thermostat at 80ºC for 2 hours. The filter with fixed DNA was placed in a bath with a reaction buffer containing a digoxigenin-labeled probe (GGAT)4. During incubation, this probe bound to individual complementary DNA fragments. After washing, these binding sites were detected by immunochemical analysis. In this case, the streptavidin-alkaline phosphatase conjugate was bound to digoxigenin and, after introducing special dyes into the solution, was detected in the form of colored bands on the filter , . The number and distribution of these bands was characteristic for each individual, and the frequency of occurrence of individual bands was different in different groups of fish. Data on the occurrence of bands was used in calculations of population genetic parameters – heterozygosity, genetic distances, etc. .
3. Main results
After carrying out the molecular hybridization reaction and visualizing DNA fragments, from 20 to 30 colored bands were detected in each electrophoretic lane (Fig).
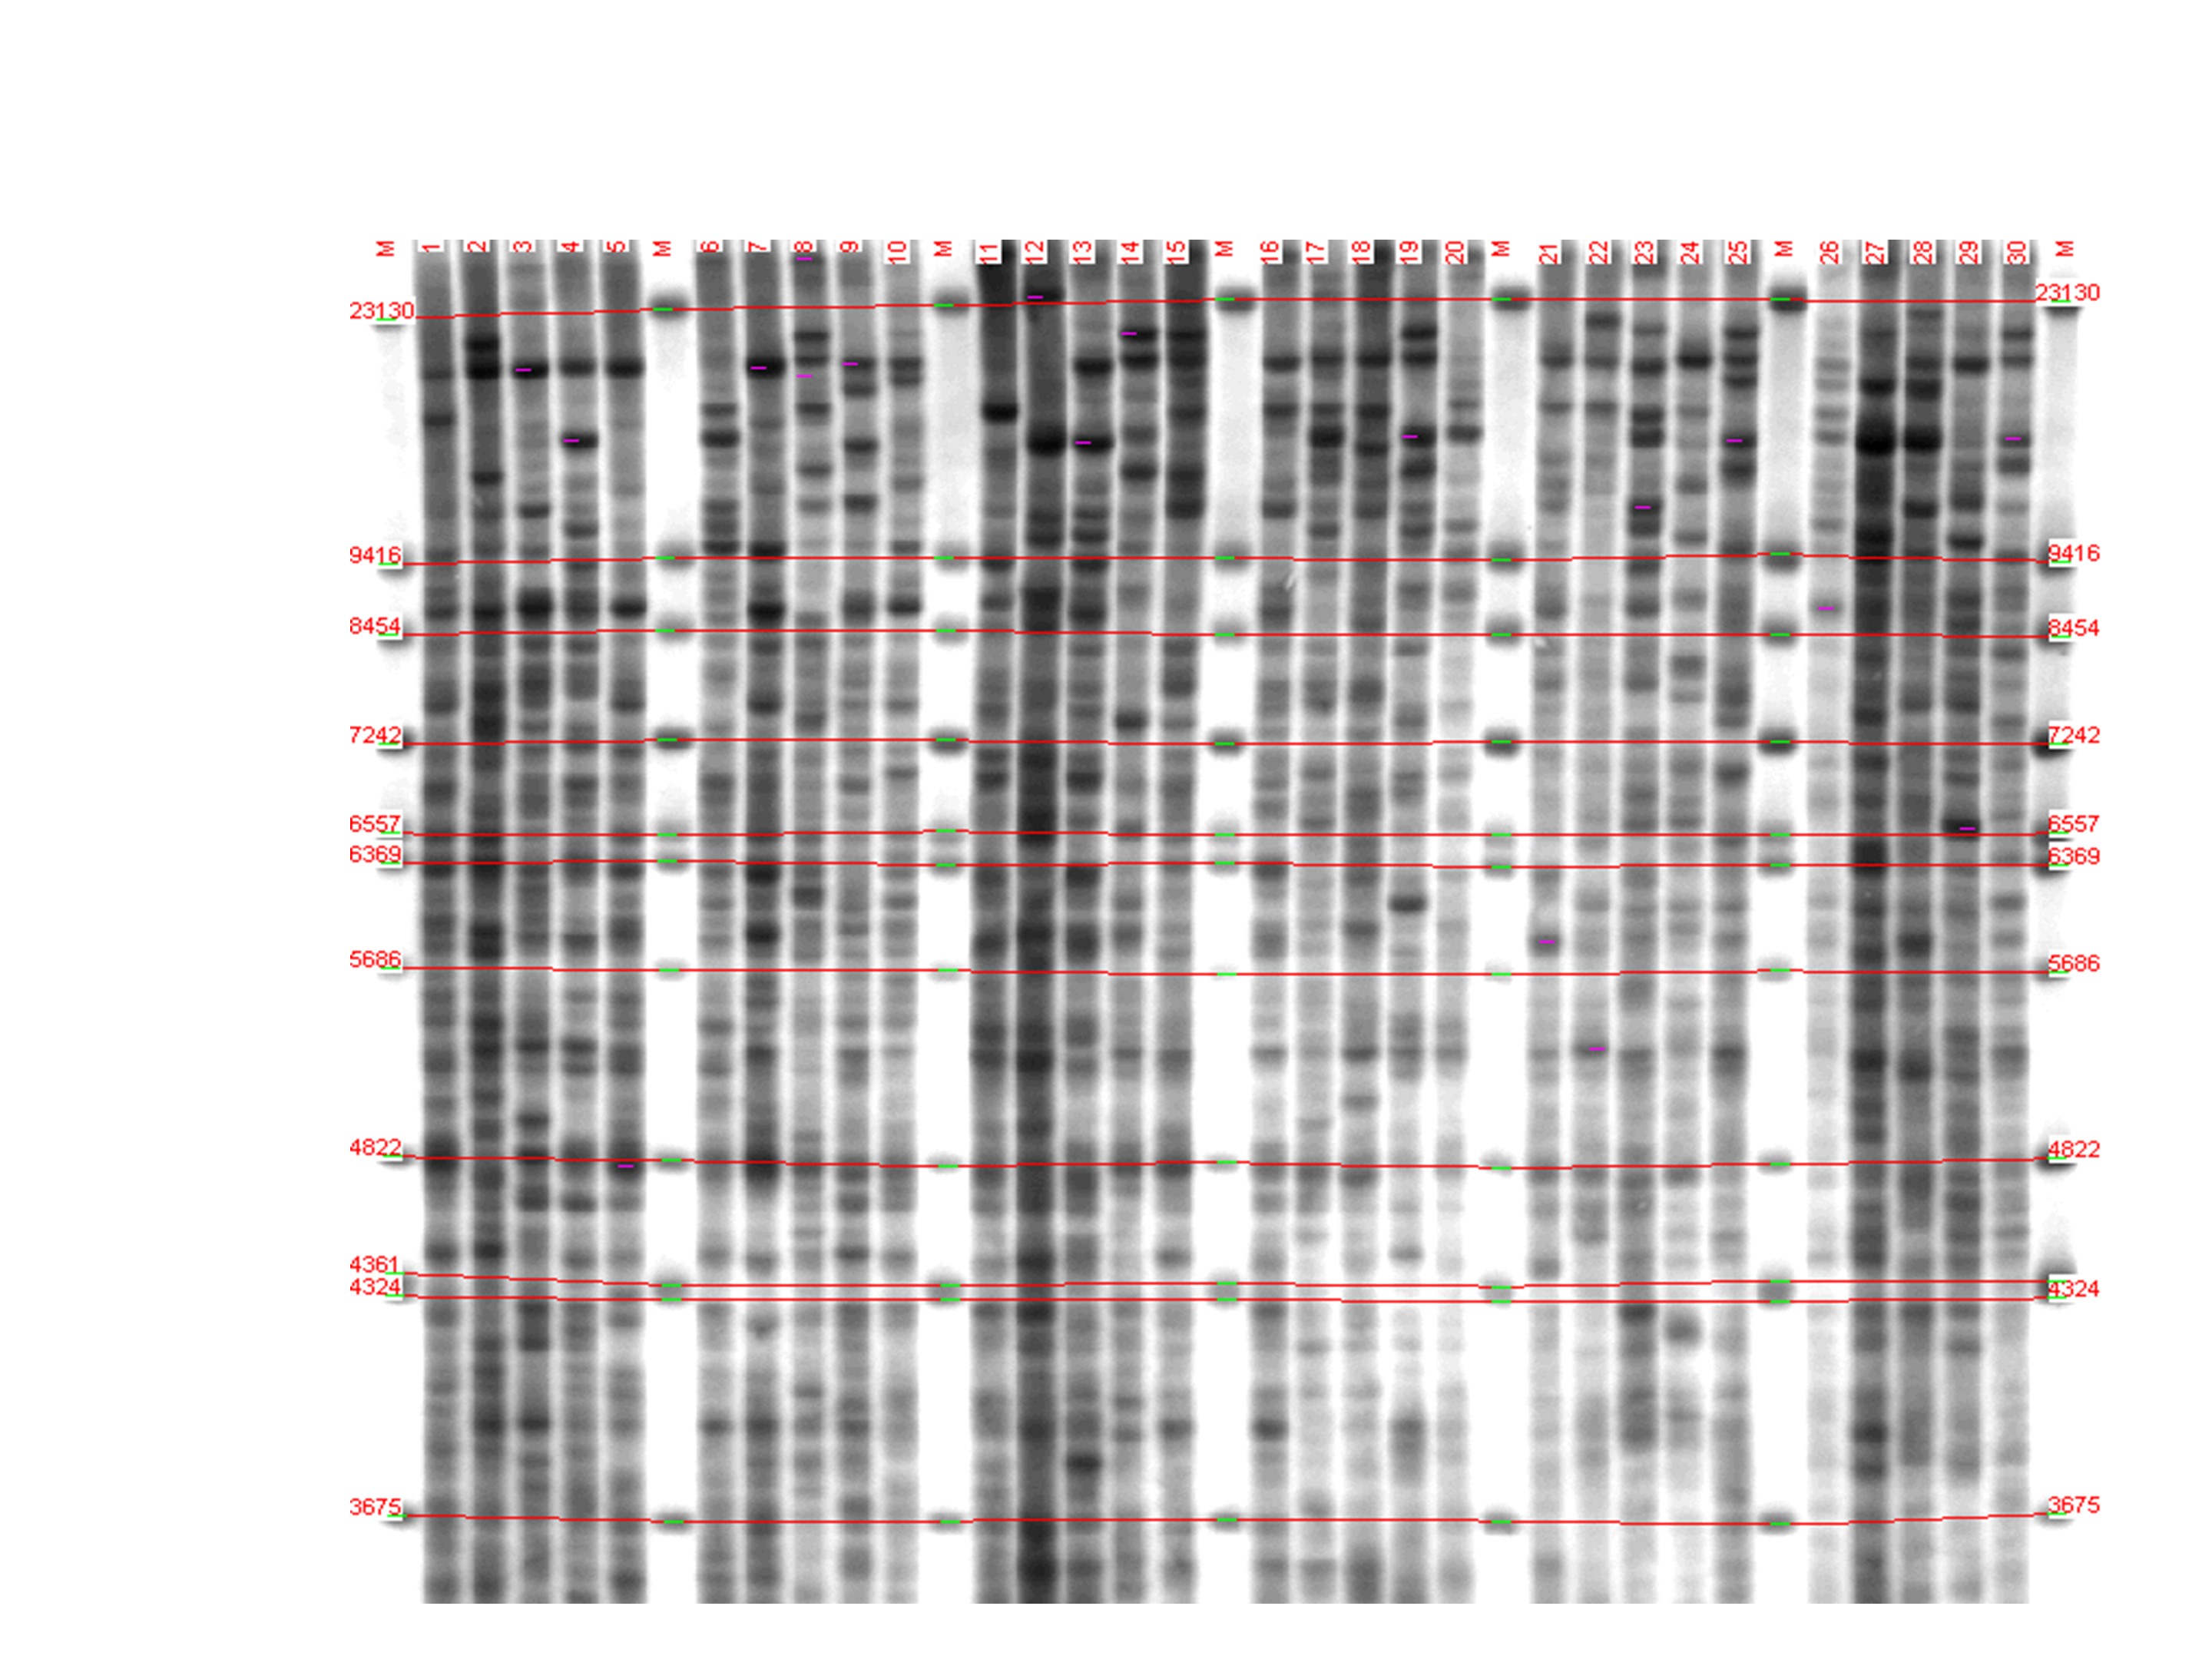
Figure 1 - Genetic profiles of individuals of three groups of fish, revealed by multilocus analysis:
lanes 1-10 – Onega salmon; 11-20 – Caspian salmon; 21-30 – Baltic salmon; M – fragment length marker
Note: lambda phage DNA, digested with HindIII BstNII restriction endonucleases, sizes from 3675 to 23130 base pairs
Table 1 - Population genetic parameters in three groups of fish according to multilocus DNA fingerprinting data
Fish groups in comparison | Number of DNA fragments per lane X±m | BS1 | BS2 | D | P |
Baltic salmo | 33.2±1.57 | 0.57 | 0.53 | 0.070 | 9.23x10⁻⁹ |
Onega salmon | 33.3±1.11 | 0.63 | 1.63x10⁻⁷ | ||
Baltic salmon | 33.2±1.57 | 0.57 | 0.43 | 0.130 | 9.23x10⁻⁹ |
Сaspian salmon | 39.2±1.97 | 0.55 | 7.04x10⁻¹¹ | ||
Onega salmon | 33.3±1.11 | 0.63 | 0.44 | 0.150 | 1.63x10⁻⁷ |
Сaspian salmon | 39.2±1.97 | 0.55 | 7.04x10⁻¹¹ |
Note: P is the probability of occurrence of two individuals with an identical genetic profile based on all recorded DNA fragments, BS1 is the coefficient of similarity within a group of fish, BS2 – coefficient of similarity between groups of fish, D – genetic distance
Due to the fact that salmon fish at early stages of development do not clearly demonstrate their breed characteristics, genetic analysis allows for identification of breeds (certification). This can be done either by calculating the frequency of DNA fragments in each group, or by identifying DNA fragments that are characteristic only for one group (marker fragments). The multilocus analysis made it possible to identify a number of promising DNA marker fragments characterizing individual groups of fish (Table 2).
Table 2 - Marker DNA fragments and their frequencies in samples of fish of three groups according to multilocus DNA fingerprinting data
DNA fragment ID | DNA fragment frequency | Population DNA fragment frequency (q). q = 1-√(1-p) | ||||
I | II | III | I | II | III | |
21 | 0.0 | 0.3 | 0.9 | 0.0 | 0.2 | 0.7 |
41 | 0.8 | 0.2 | 0.0 | 0.6 | 0.1 | 0.0 |
42 | 1.0 | 0.2 | 0.1 | 1.0 | 0.1 | 0.1 |
53 | 1.0 | 1.0 | 1.0 | 1.0 | 1.0 | 1.0 |
65 | 0.9 | 0.0 | 0.1 | 0.7 | 0.0 | 0.1 |
67 | 1.0 | 1.0 | 1.0 | 1.0 | 1.0 | 1.0 |
70 | 1.0 | 1.0 | 1.0 | 1.0 | 1.0 | 1.0 |
82 | 0.9 | 0.0 | 0.3 | 0.7 | 0.0 | 0.2 |
94 | 0.3 | 1.0 | 0.3 | 0.2 | 1.0 | 0.2 |
122 | 0.2 | 1.0 | 0.3 | 0.1 | 1.0 | 0.2 |
123 | 0.7 | 0.0 | 0.1 | 0.5 | 0.0 | 0.1 |
Note: I – Caspian salmon; II – Onega salmon; III – Baltic salmon
It can be seen that DNA fragment number 21 (when visualizing fragments, they are numbered on the filter depending on the fragment size) is characteristic for Baltic salmon (frequency 0.9), it is rarely found in Onega salmon and absent in Caspian salmon. Some fragments are found in all individuals of all groups, i.e. are monomorphic, thus, they and not informative for subsequent analysis. Obviously, the geographic remoteness of the Caspian salmon habitat from the water resources of North-West Russia, which prevents any fish crossing, predetermined the accumulation of genetic differences of the Caspian salmon from the Baltic and Onega salmon.
4. Conclusion
Thus, the results of the study of three populations of salmon fish, obtained by multilocus analysis, indicate the promise of using this analysis to identify the specific features of the genetic and population structure of groups of fish of the salmon family. Genetically distant from the Baltic and Onega, salmon is the group of Caspian fish. Marker DNA fragments have been identified that allow certification of fish breeds and populations. Multilocus analysis of salmon genomic DNA proved to be an efficient approach for breed identification (certification), elucidation of population structure of fish groups and determination of intra-population genetic diversity by a criterion of average heterozygosity.