Colonies of Red Wood Ants (Formica s. str.) on the Forest Monitoring Map of the Middle Volga
Colonies of Red Wood Ants (Formica s. str.) on the Forest Monitoring Map of the Middle Volga
Abstract
The current article is devoted to common and specific methods of digital mapping used in environmental monitoring of forest phytocenoses on the example of Middle Volga regions. It includes export and analysis of such significant ecological criteria as landscape type, nature zone, forest type and population density of bioindicator species (in the given research – Formica ants: Hymenoptera, Formicidae). Presumably, ants form colonies and complexes in forests of precise age and quality groups, related to exact landscape type. This research aims to confirm or disprove this correlation using geodata about phytocenotic conditions of the Middle Volga and is based on GIS-platforms (ArcGIS Online, GIS-Axioma) with a cartographic service and a broad range of tools for spatial and temporal analysis. Digital cartography permits to determine the regularity or randomness of ants' population structure and further define their role as bioindicators in forest communities. Tendencies as ants` selectivity to landscape, climatic, geobotanic and soil factors are supposed to describe the real forest conditionson the given territory. Digital maps and infographic represent the spatial population structure of bioindicator species. The results of the current research can be used by regional ministries and departments of ecology and nature protection as a base for further environmental predictions and solutions in explored regions.
1. Introduction
Red wood ants (subgenus Formica s. str.) have been used as active forest protectors and bioindicators of forest conditions since 1960s
– this date can be marked as a first step of their monitoring in the Soviet Russia. Further there, the structure of anthills has been examined in details and a new environmental unit named anthill complex was determined to characterize it. Myrmecologists define anthill complexes as groups of same or related species' anthills with common feeding compartments . These new monitoring units were registered and described in several localities of the European part of Russia, and it was understood that ants directly affect the forest environment – they control populations of leaf-eating pests, form soil components and can indicate age, density and quality of forests.However, a critical lack of exact geographical data made a negative impact on existing situation picture. No information about spatial structure of anthills' complexes was present in form of maps or geobases despite full taxonomic and biological descriptions. This problem provoked a creative search for an efficient method that could provide a detailed ecological map of forest communities. In 2016, scientists of Lobachevsky State University (including the author of the current article) initiated formation of a digital map of the Middle Volga, containing information about anthills and forest conditions in each point of their localization
.The given research can be considered as a continuation of previous explorations and as analysis of existing data on a new level. It includes estimation of occurrence frequency, diversity and population density on different ant species of the Middle Volga regions on the GIS base. In "Materials and Methods" the essential analytical algorithms and program components are described. In "Results" the actual picture of spatial ants' population structure is demonstrated. In "Discussion" the results of analysis will be considered in the context of previous explorations. In "Conclusion" the necessity of digital mapping in monitoring of forest communities is estimated and generalized.
2. Research methods and principles
The purpose of the current research has been determined as formation and analysis of a detailed map of the Middle Volga. The mentionned map demonstrates the correlation of ants' dispersal with a whole complex of factors, including information about landscape, climatic and geobotanic conditions in explored regions (N. Novgorod, Samara, Saratov regions, republics of Chuvashia and Tatarstan). The data is exported to the map in four layers – lineal layer with administrative borders of Russian regions, point level which demonstrates localization of anthills and two polygonal layers created while spatial analysis (ants' population density map and clusters map showing dominant species in the Middle Volga phytocenoces).
The process of cartographical analysis consists of following steps: formation of a geodatabase in *csv format, export of the base on ArcGIS Online, creation of the colonies` density map, definition of dominant species and the final association of ants` population structure with key factors (landscape type, nature zone, climate, forest type).
As for data about forest growing conditions in the regions (age, density, productivity, quality), it was taken in format of published forest plans from the open sources, such as regional departments of Federal Agency for Forestry, and added to each point of the existing map as detailed information
, , .The main materials had been gathered during 2005-2018 by scientists of Lobachevsky State University as results of field explorations
, . It includes data about 6 species of red wood ants in the Middle Volga territory located in 88 points – there are single anthills represented as well as anthills complexes. During the current research, the necessity and preciseness of digital mapping in environmental monitoring have been proven and an amount of gaps in geodata has been filled.The method of population density analysis is based on the platform ArcGIS Online. This is a cartographical service created by ESRI CIS company which provide access to basemaps, map formation and analytical operations (e.g. clustering, aggregation, "hot points" analysis etc.) , . At the moment, as ESRI banned the access to their software due to the sanction measures, ArcGIS data is being converted into a geodatabase on the Russian GIS-platform "Axioma". In the given research, the density is measured while constructing a color map of "cold" and "hot" areas. "Hot areas" are clusters where dominant ant species can be determined and associated with landscape, climatic and forest-growing conditions.
The statistical analysis of results bases on the StatTech platform. Statistical analysis was carried out using the StatTech v. 3.1.4 (developer – Stattech LLC, Russia). Quantitative indicators were assessed for compliance with the normal distribution using the Shapiro-Wilk test (with the number of subjects less than 50) or the Kolmogorov-Smirnov criterion (with the number of subjects more than 50). In the absence of a normal distribution, quantitative data were described using the median (Me) and the lower and upper quartiles (Q1 – Q3). Categorical data were described with absolute values and percentages. Comparison of two groups in terms of a quantitative indicator, the distribution of which differed from the normal one, was performed using the Mann-Whitney U-test. Comparison of percentages in the analysis of four-field contingency tables was carried out using Pearson's chi-square test (with values of the expected phenomenon more than 10) Comparison of percentages in the analysis of multifield contingency tables was performed using Pearson's chi-square test
.3. Main results
The initial map shows geographic patterns of ants' dispersal on the explored territory without association with abiotic factors. It can be seen that most anthills are located in Nizhny Novgorod region and have essentially a homogenous spatial structure – several localities contain anthills of various species which cannot be estimated as complexes in terms of their morphogenetical differences despite short distances between them. Several single anthills are located on the borders of Nizhny Novgorod region and the republic of Mari El and in the Chuvash republic (Figure 1).
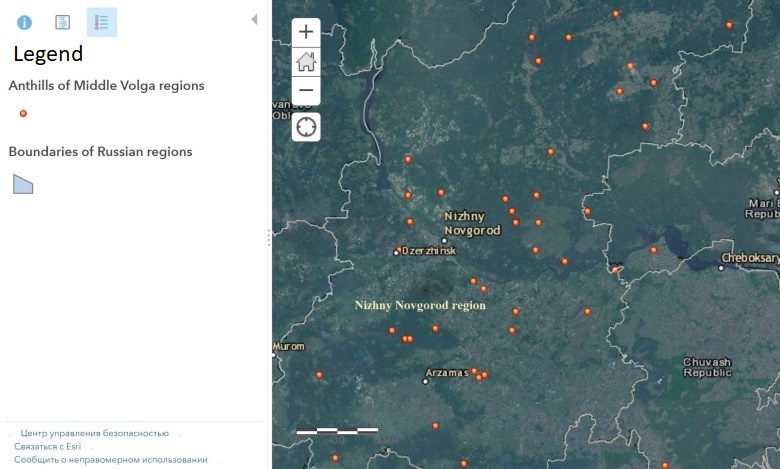
Figure 1 - Dispersal of red wood ants (Formica s. str.) in the Middle Volga
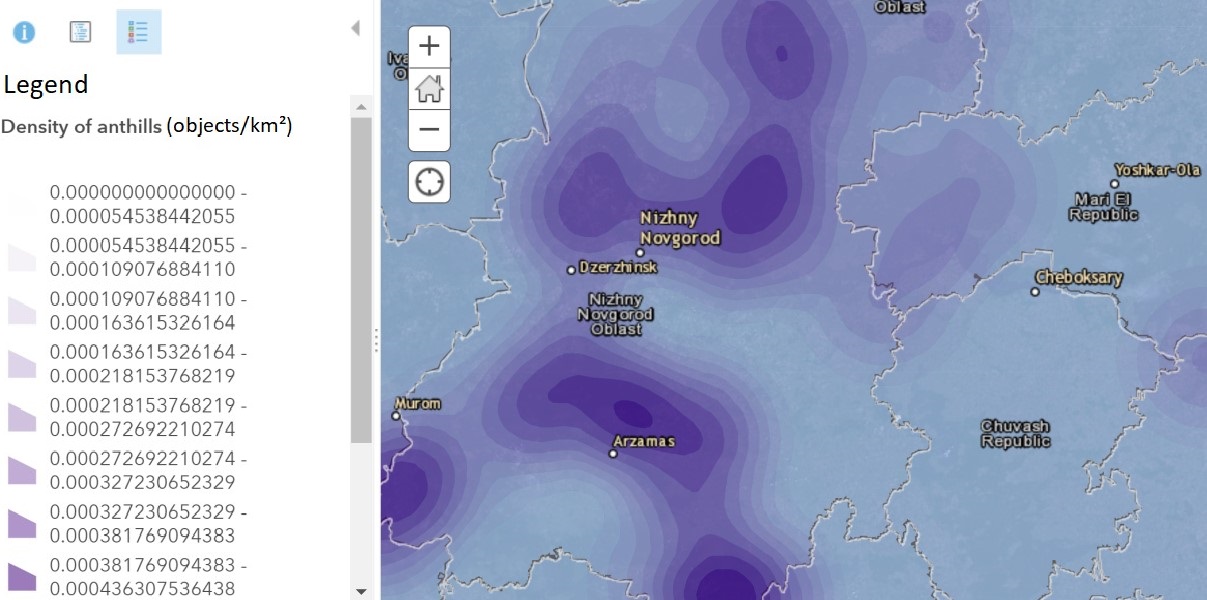
Figure 2 - Density of red wood ants` (Formica s. str.) colonies in the Middle Volga
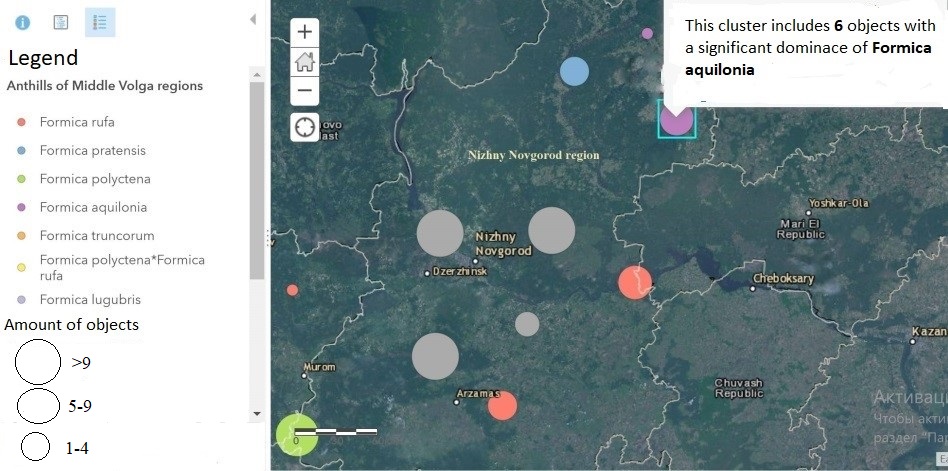
Figure 3 - Clusters with dominant species of of red wood ants (Formica s. str.) in the Middle Volga
As a result of comparing the "Colony type" indicator depending on the "Age" indicator, statistically significant differences were discovered (p < 0,001) (Table 1, Figure 4).
Table 1 - Analysis of the indicator "Colony type" depending on the indicator "Age"
Index | Categories | Age | p | ||
middle-aged | ripening | young | |||
colony type | complex | 11 | 8 | 0 | < 0,001* p middle-aged – young < 0,001 p ripening – young < 0,001 |
% | 47,8 | 80,0 | 0,0 | ||
single anthill | 12 | 2 | 55 | ||
% | 52,2 | 20,0 | 100,0 | ||
Note: * - differences in indicators are statistically significant (p < 0,05)
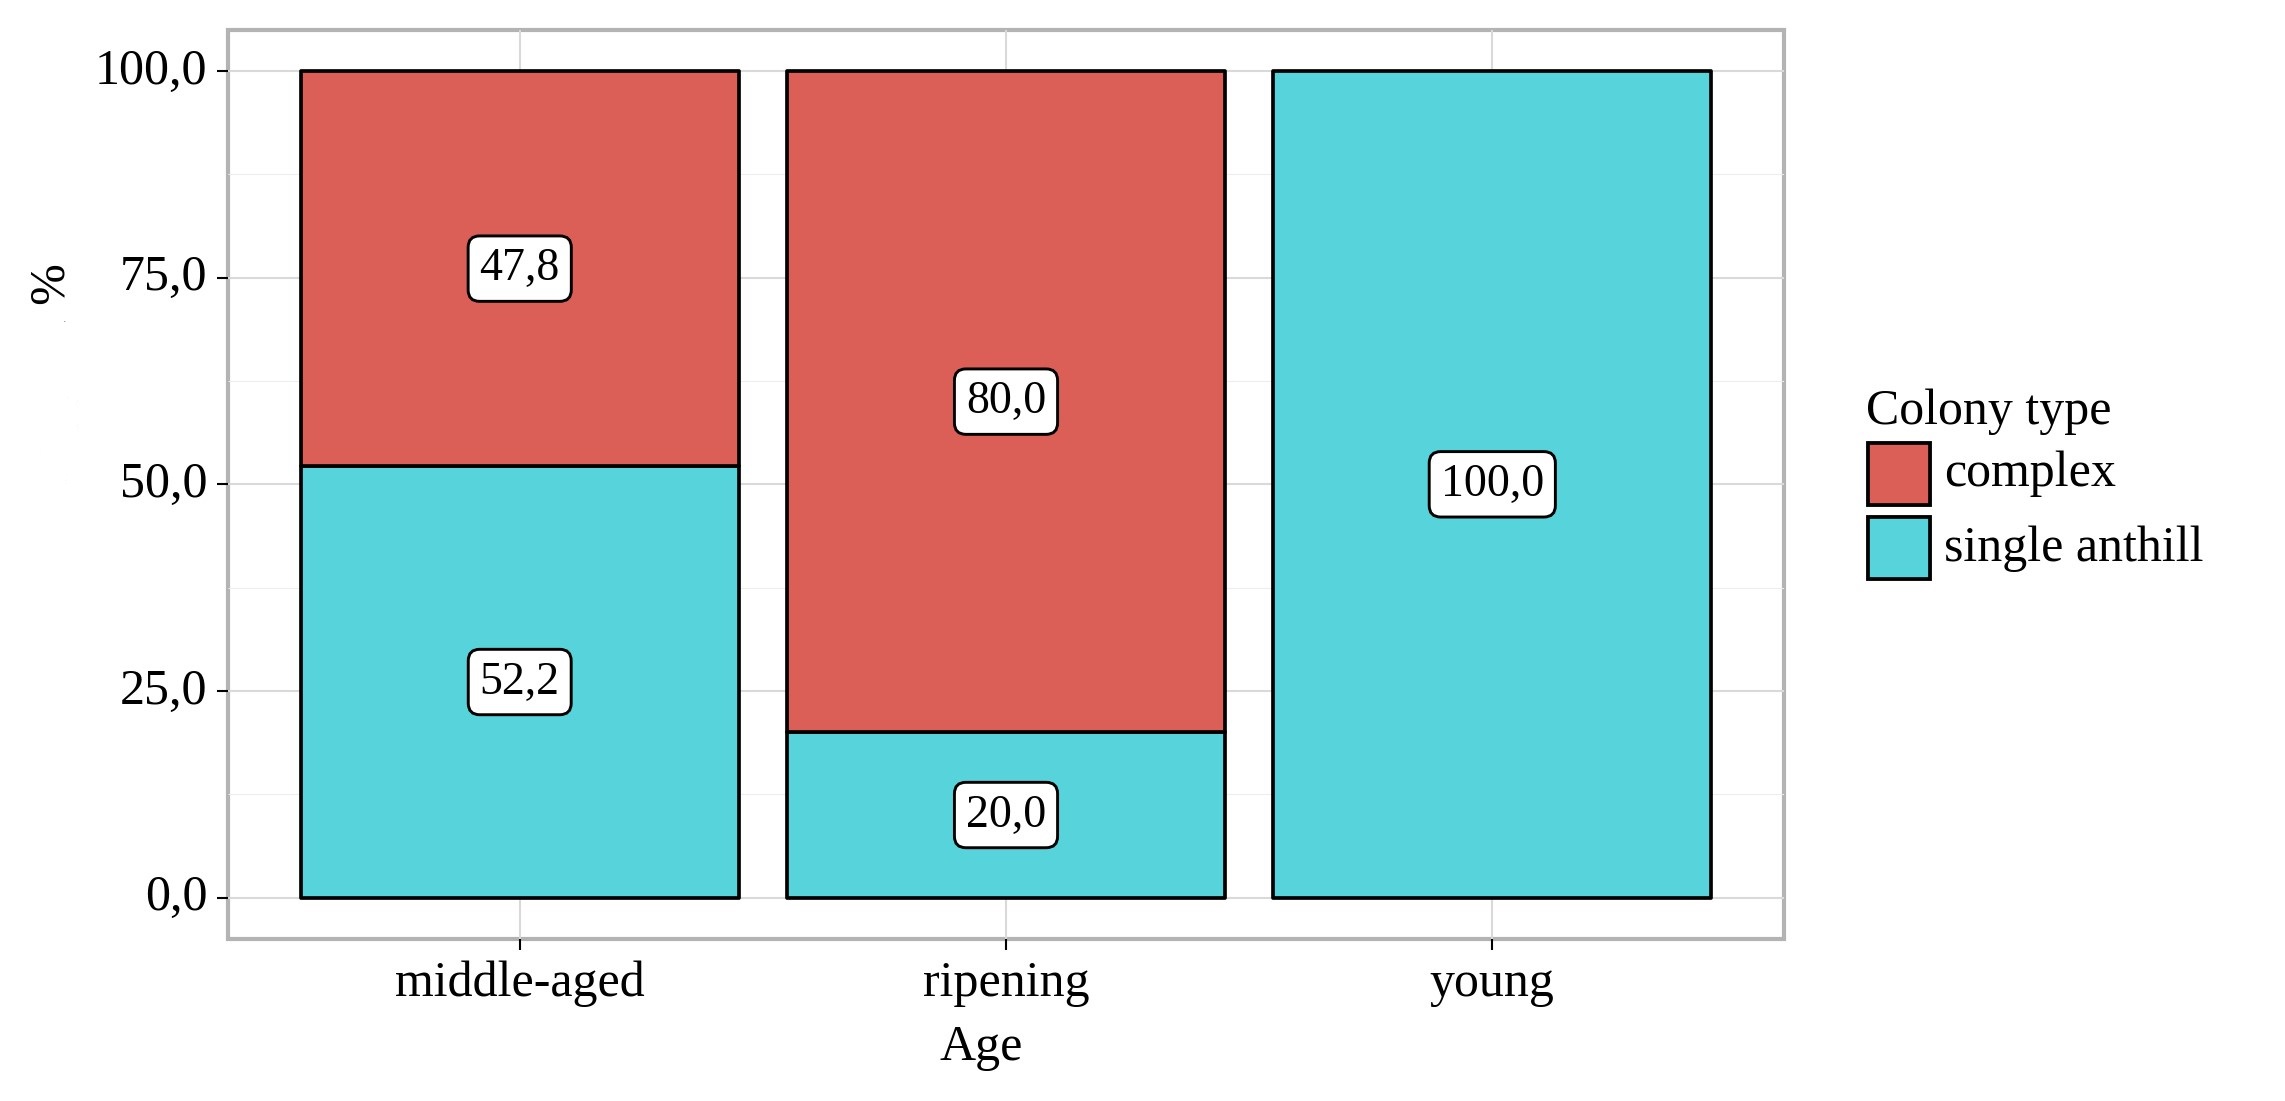
Figure 4 - Analysis of the indicator "Colony type" depending on the indicator "Age"
Table 2 - Analysis of the sensibility and specificity of the model depending on the threshold values of the indicator "Density"
Threshold | Sensibility (Se), % | Specificity (Sp), % | PPV | NPV |
1 | 94,2 | 52,6 | 87,8 | 71,4 |
1 | 66,7 | 94,7 | 97,9 | 43,9 |
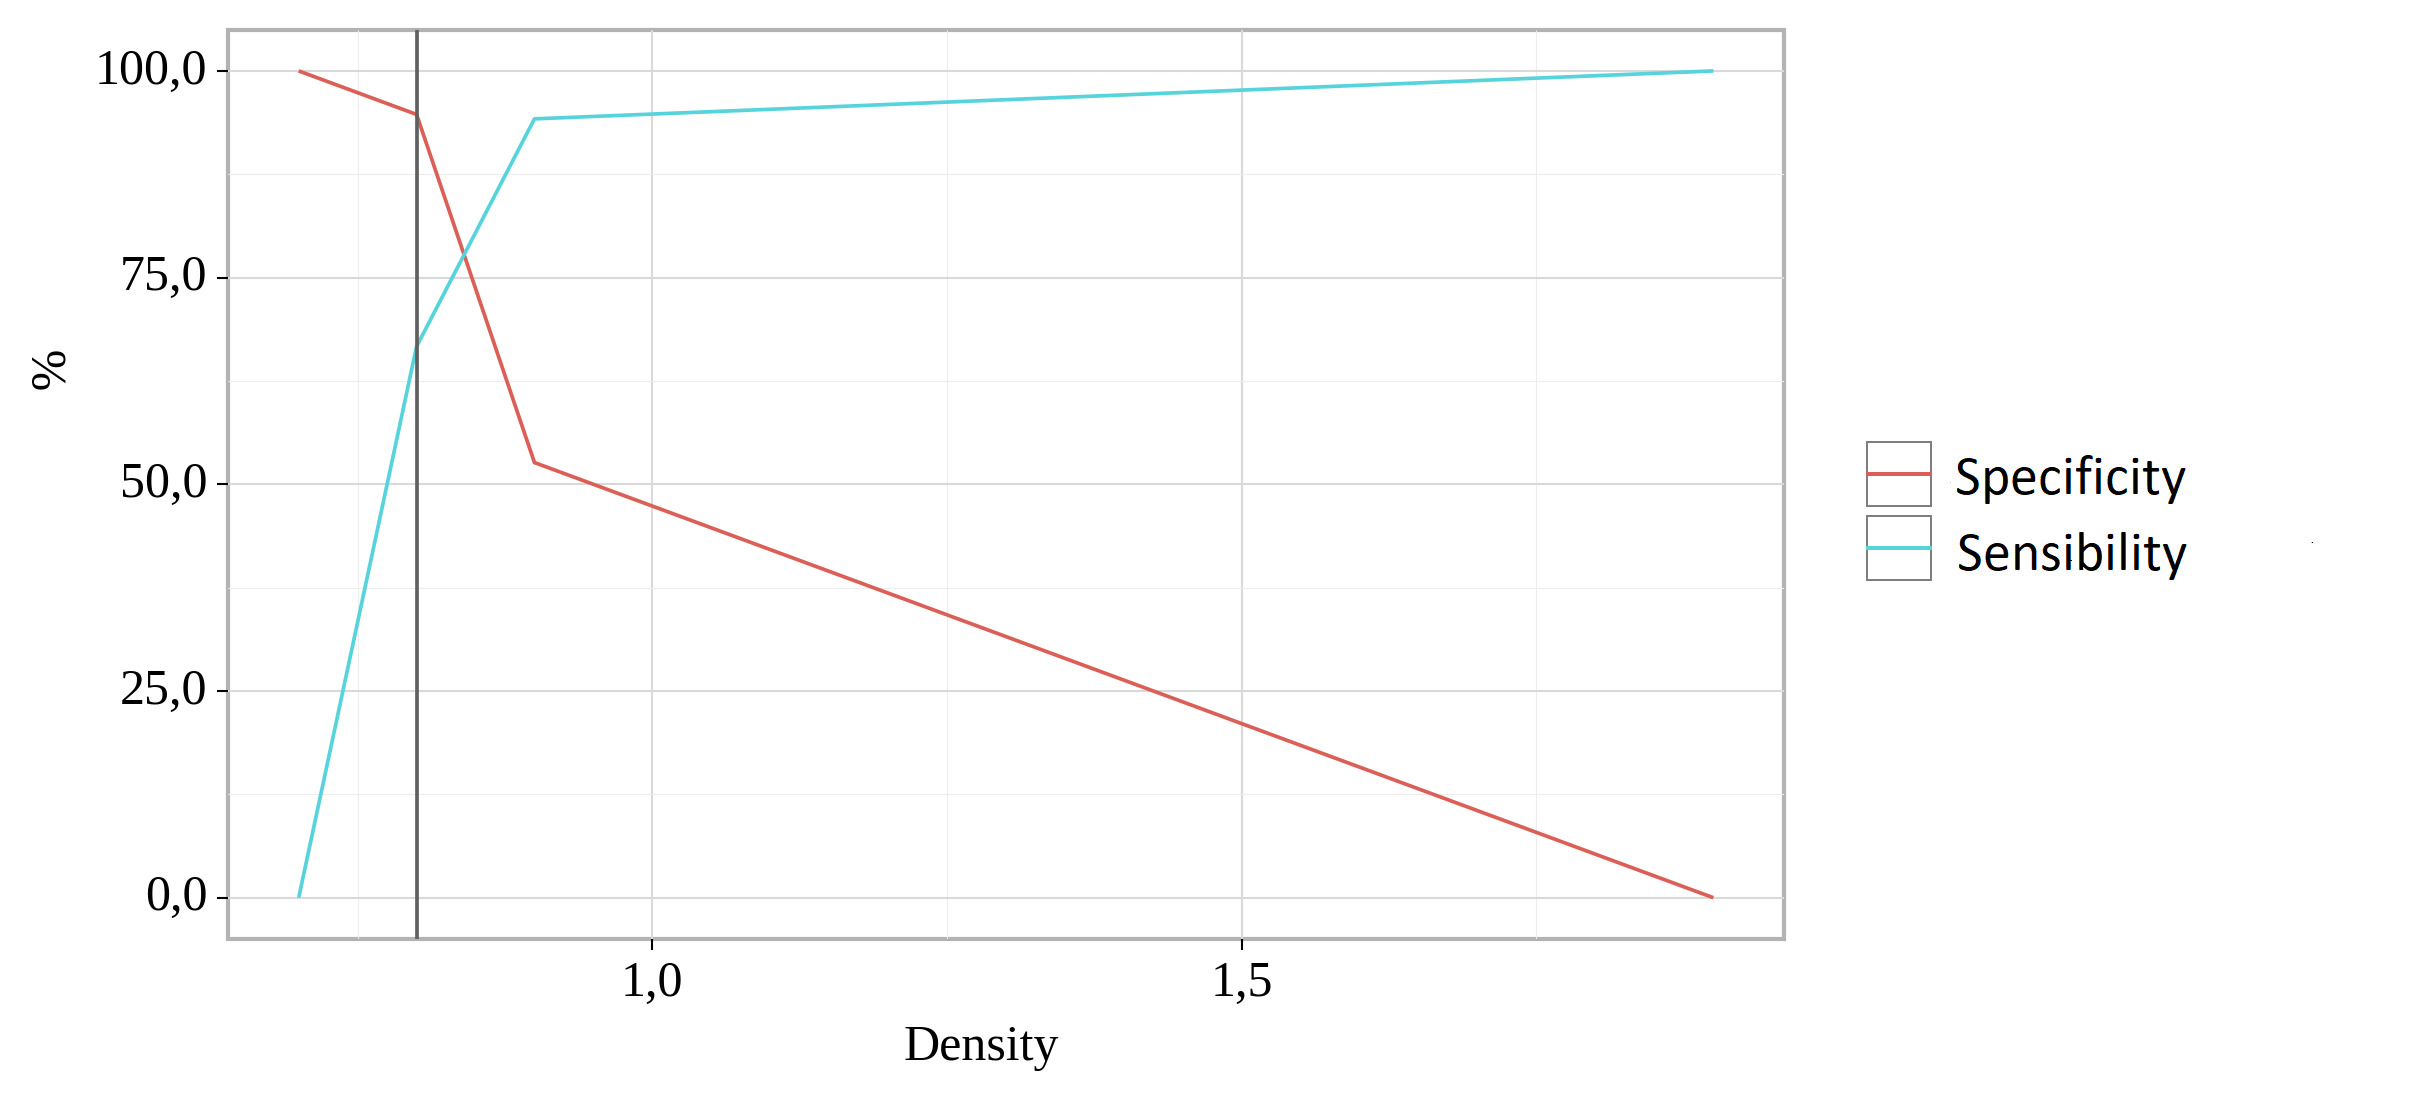
Figure 5 - Analysis of the sensibility and specificity of the model depending on the threshold values of the indicator "Density"
Table 3 - Analysis of the indicator "Colony type" depending on the indicator "Productivity"
Index | Categories | Productivity | p | ||
II | III | IV | |||
colony type | complex | 0 | 8 | 11 | < 0,001* p II – IV = 0,006 p III – IV = 0,007 |
% | 0,0 | 15,7 | 47,8 | ||
single anthill | 14 | 43 | 12 | ||
% | 100,0 | 84,3 | 52,2 | ||
Note: * - differences in indicators are statistically significant (p < 0,05)
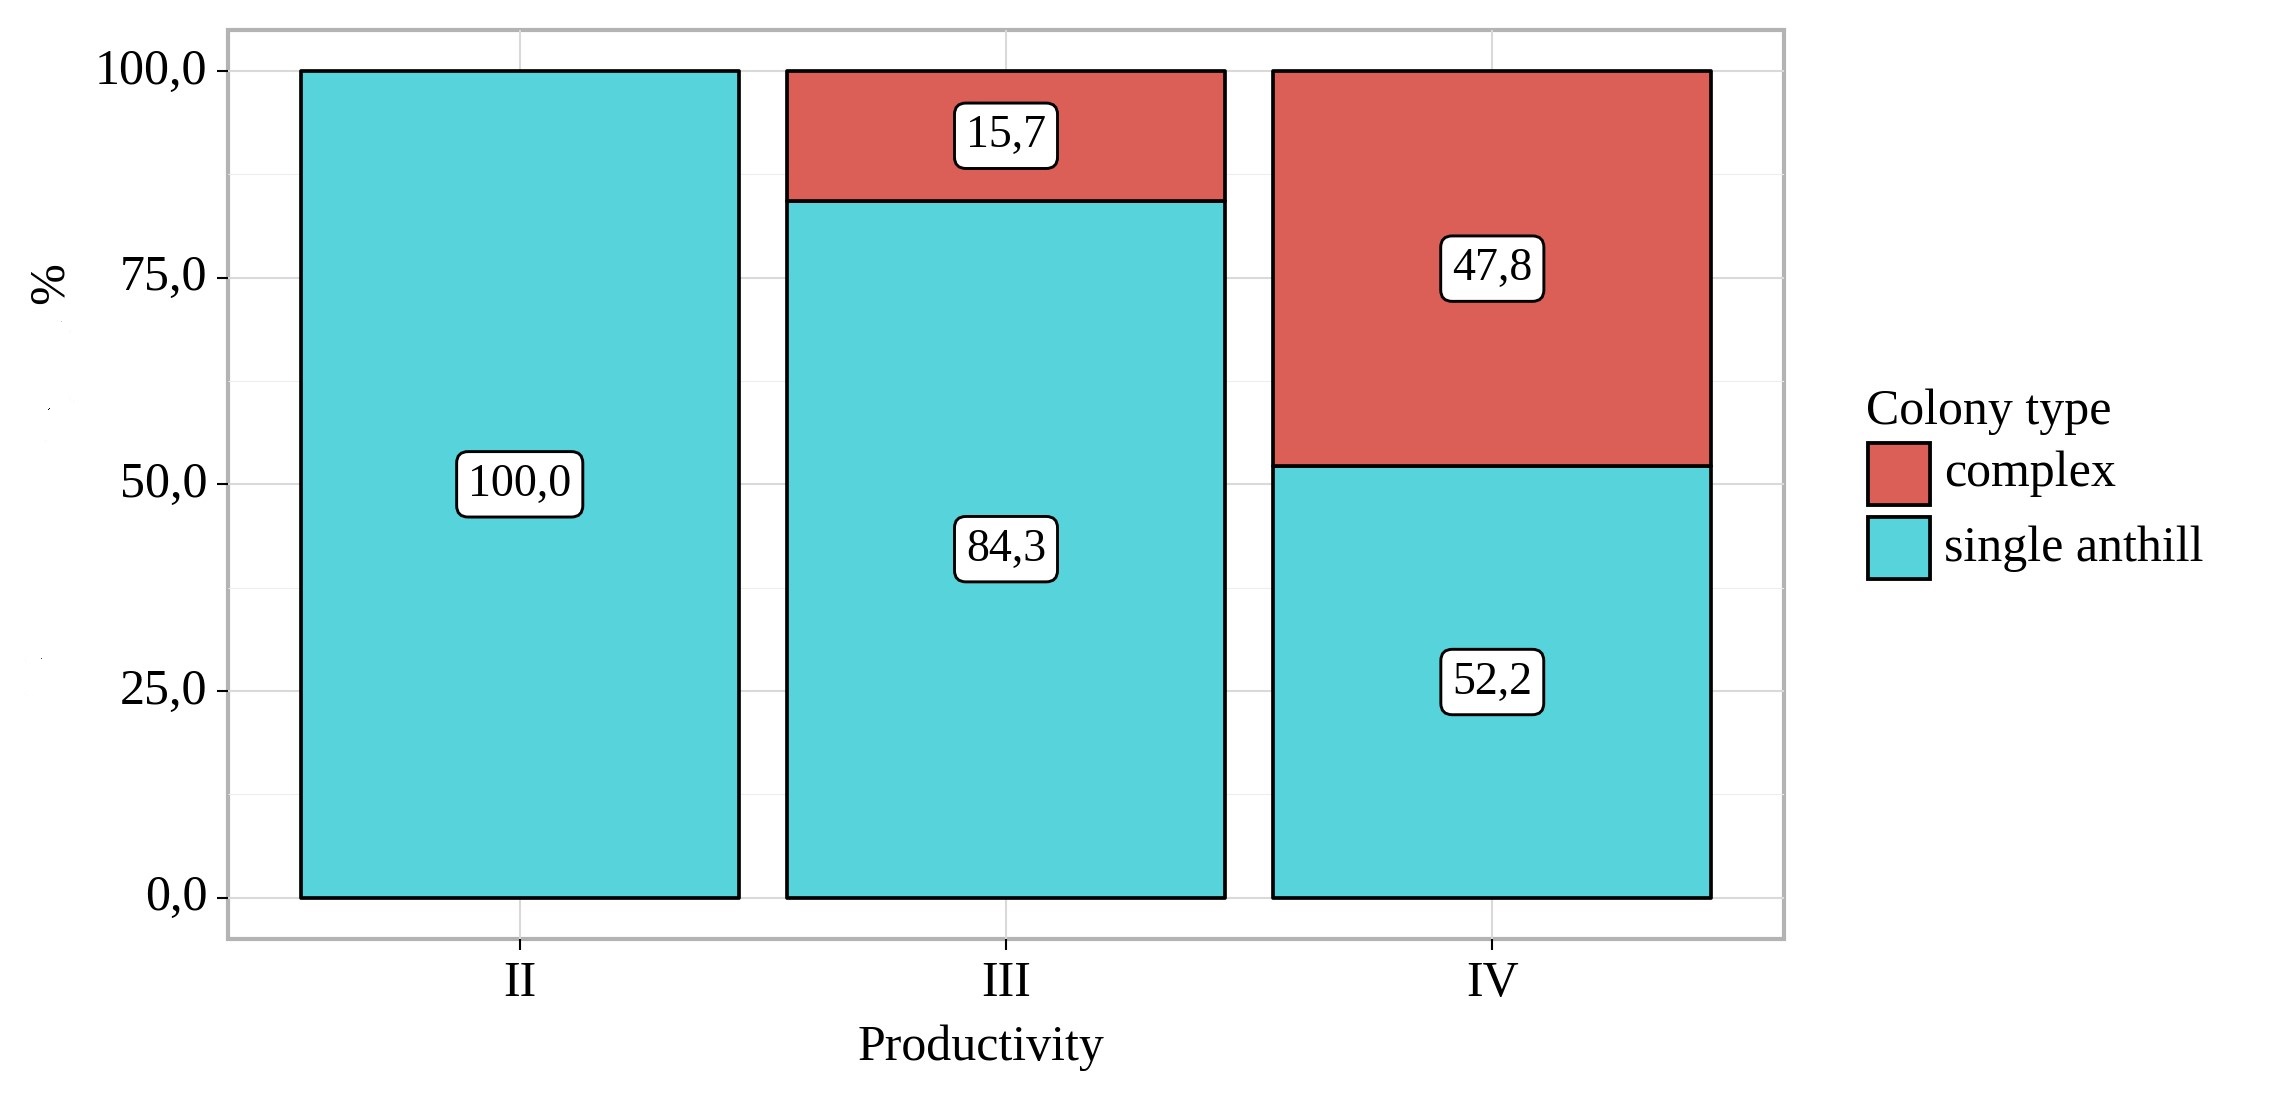
Figure 6 - Analysis of the indicator "Colony type»" depending on the indicator "Productivity"
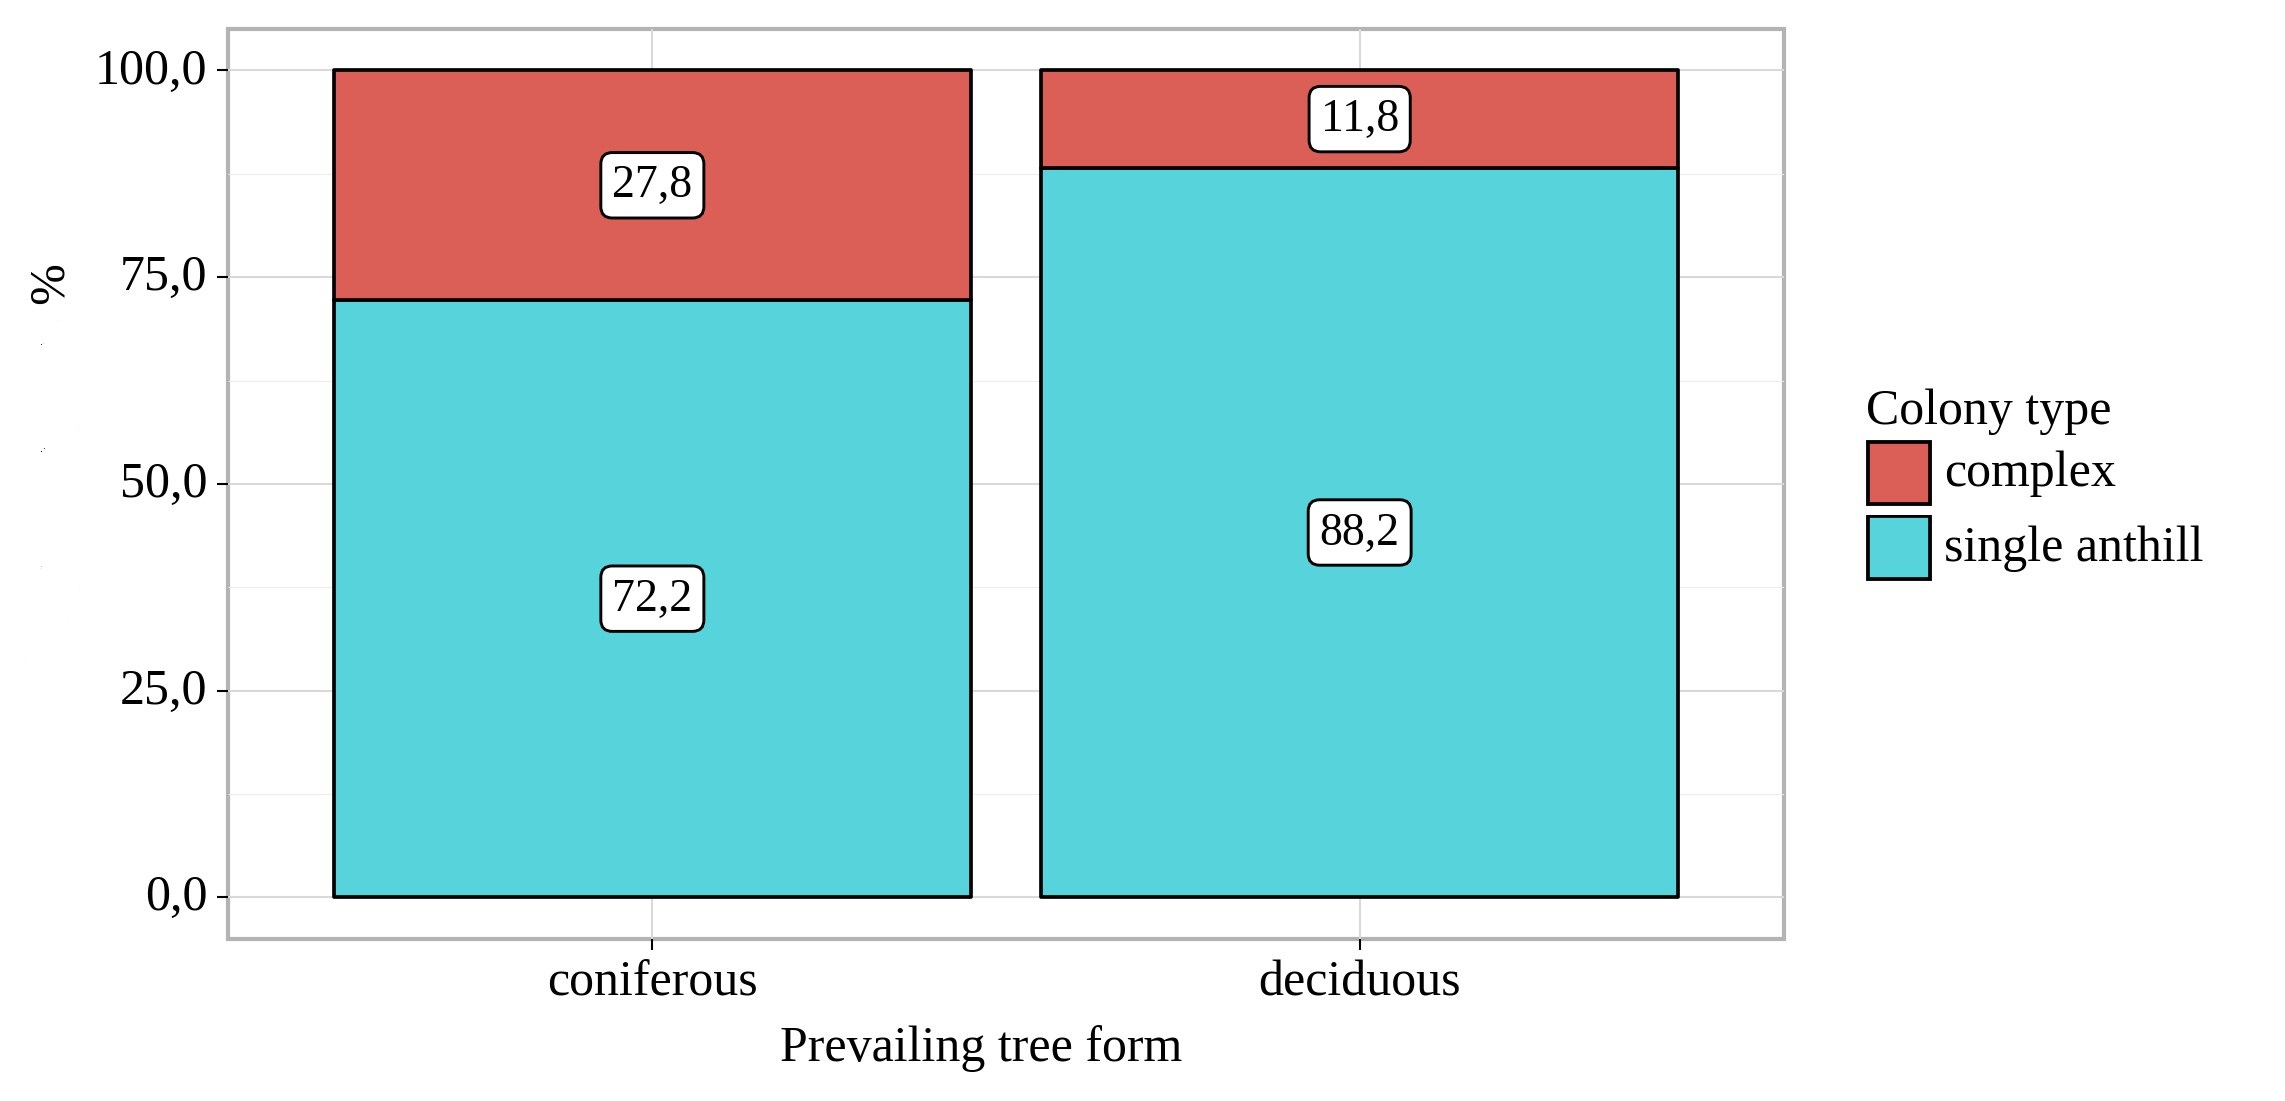
Figure 7 - Analysis of the indicator "Colony type" depending on the indicator "Prevailing tree form"
Table 4 - Analysis of the indicator "Colony type" depending on the indicator "Prevailing tree form"
Index | Categories | Prevailing tree form | p | |
coniferous | deciduous | |||
colony type | complex | 15 | 4 | 0,075 |
% | 27,8 | 11,8 | ||
single anthill | 39 | 30 | ||
% | 72,2 | 88,2 | ||
4. Discussion
The cartographical data released in the current research coincide in several questions of population ecology with results of previous explorations got in 2010-2014 and purposed on determination of population structure patterns of Formica ants. According to them, Formica aquilonia tends to inhabit coniferous forests with pine prevalence and forms large complexes rather than single anthills .
Besides that, the aspect of ants` widespread in dependence on landscape zoning was examined before by scientists of Lobahevsky state university – they carried out research with an initial hypothesis that anthills tend to form "thickening areas" on the borders of different landscape zones and demonstrate selectivity to dense forests in comparison with open forest-steppes and meadows . Although, this data ought to be confirmed with statistical analysis that is planned by the author in the current year.
Overall, there seem no GIS-methods having been used in previous experience of ant colonies monitoring inside forest communities of the European Russia. This fact highlights the necessity to visualize monitoring data on digital maps and to fill existing information gaps using methods of cartographical analysis.
Finally, it is necessary to empathize that digital mapping deals with problems connected with contradictions in data levels, e.g., shortage of detailed information about size and number of insects in anthills – this data cannot be correlated with detailed information about forest-growing conditions in the given phytocenoses. This inconvenience can be resolved using other forms and mobile applications for data gathering based on geographic information systems, such as Survey123 for ArcGIS or Collector for ArcGIS .
5. Conclusion
According to the results of the given research, red wood ants (subgenus Formica s str.) tend to demonstrate selectivity to climatic and forest growing conditions (forest type, age, density, productivity), what makes them significant bioindicators for quality monitoring of forest communities (higher population density indicates older phytocenoses of secondary quality which need more protection). These results are not a final stage – they can be regularly updated with new materials of field explorations.
In addition, it was proven that cartographical analysis provides a clearer picture of the ecological situation in regions taking into account "problematic" points with potentially damaged forests or forests under threat of leaf-eating pests. It permits to use geoinformation systems while inventory and estimation of local forestries. This data needs to be published in open access for both scientific communities and regional ecological ministries to determine forest zoning plans and cultivation plans for next years and decades.