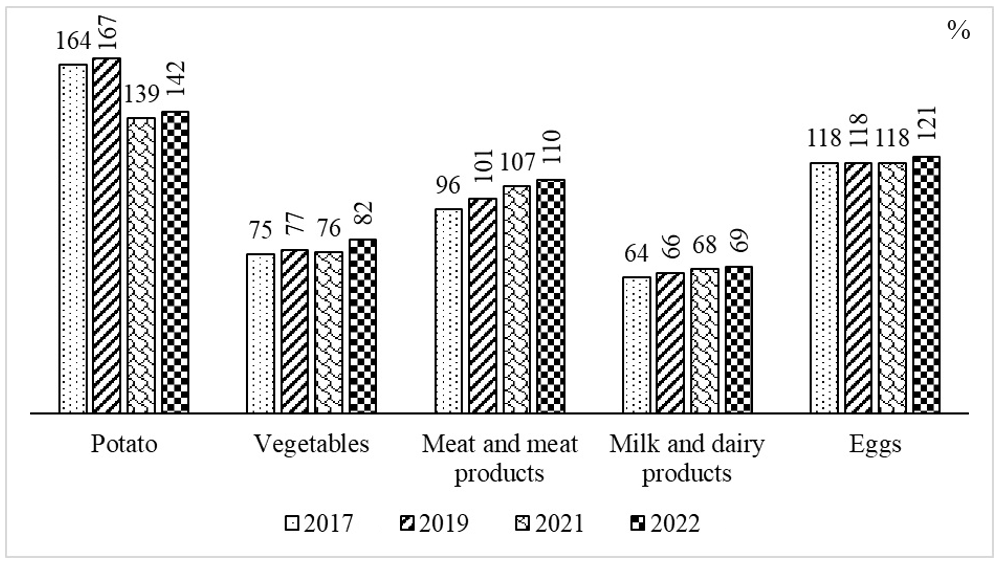
Вернуться к статье![Dynamics of the ratio of the level of production per capita with rational standards for certain types of products in 2017-2022](/media/images/2024-05-20/4d8c95bb-40cb-4a9a-879c-161c73ed0113.png)
Strategic planning of budgetary provision of physical availability of products
Figure 1 - Dynamics of the ratio of the level of production per capita with rational standards for certain types of products in 2017-2022
![Dynamics of the ratio of the level of production per capita with rational standards for certain types of products in 2017-2022](/media/images/2024-05-20/4d8c95bb-40cb-4a9a-879c-161c73ed0113.png)
Figure 1 - Dynamics of the ratio of the level of production per capita with rational standards for certain types of products in 2017-2022